
|
|
|
County Health Patterns -- health analytics resources & methods
As the population ages, migrates and otherwise changes, health status and healthcare needs change by location, type and in other ways. Data on health status, characteristics and trends continue to become more available, particularly at the county geographic level ... but these data are often difficult to locate, integrate and use in a combined manner. VA Hospitals/Facilities in Context of Urban/Rural Areas The following graphic illustrates how Veterans Administration hospitals and facilities (red markers) can be viewed in context of urban/rural patterns. Urban areas are shown with orange fill pattern. The Appalachia 405 county area is shown with black bold boundary. Use (GIS) resources to examine additional patterns such as the distribution of veterans by census tract based on the American Community Survey (ACS) data. 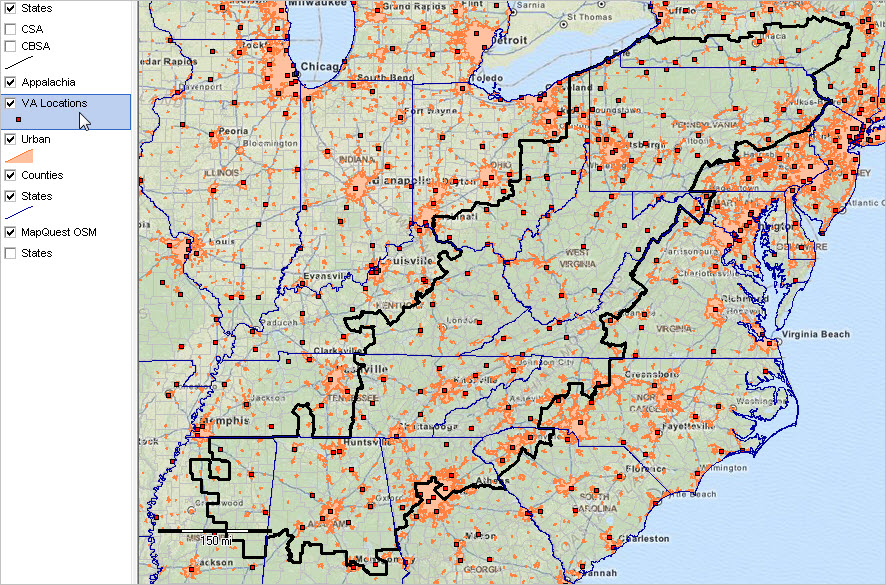 -- view created using CV XE GIS and associated county health GIS Project -- click graphic for larger view showing details. Supplemental views of Appalachia Region: Appalachia counties shown with bold black boundary. • Cities by 2014 Population Size • Cities by Population Percent Change 2010-2014 County Health Analytics This section provides an overview of accessing, integrating and analyzing demographic, economic and health data with a focus on county and sub-county geography. Geographic information system (GIS) tools are used to visually and geospatially analyze health-related patterns and characteristics. Applications reviewed here are developed using the CV XE GIS software and associated U.S. national scale health GIS Project. The County Health Patterns GIS project includes data from: • ProximityOne CountyTrends and Situation & Outlook ... view individual county population & components of change annual estimates and trends ... click county link in this interactive table • Robert Wood Johnson Foundation County Health Rankings • Appalachian Regional Commission economic status • Other sources. See additional information Additional ProximityOne ready-to-use shapefiles could be added containing all data from the American Community Survey demographic-economic profiles. The same scope of subject matter, annually updated, is available at the ZIP code, census tract, county and other geography. See related interactive tables (four related web sections) for subject matter details. The CV XE GIS software is used with the County Health Patterns GIS project to develop views/applications shown below. These views/applications illustrate how the health analytics resources can be used. Select from wide ranging alternative measures. Patterns of Population Change -- %Change 2010-2014 -- U.S. by County The following view shows patterns of %population change 2010-2014 using the CountyTrends layer/dataset. 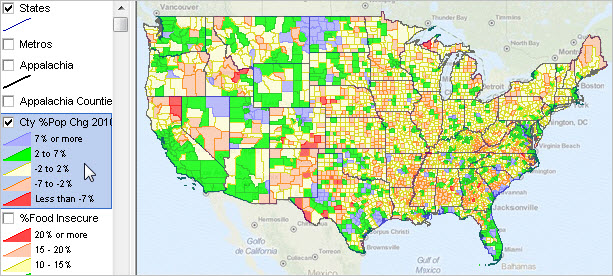 -- view created using CV XE GIS and associated county health GIS Project -- click graphic for larger view showing details. Site Analysis & Patterns of Population Change -- %Change 2010-2014 -- Houston Metro Area The following view shows patterns of %population change 2010-2014 using the CountyTrends layer/dataset. This view also illustrates use of the Site Analysis tool to aggregate and display population by year 2010 through 2014. 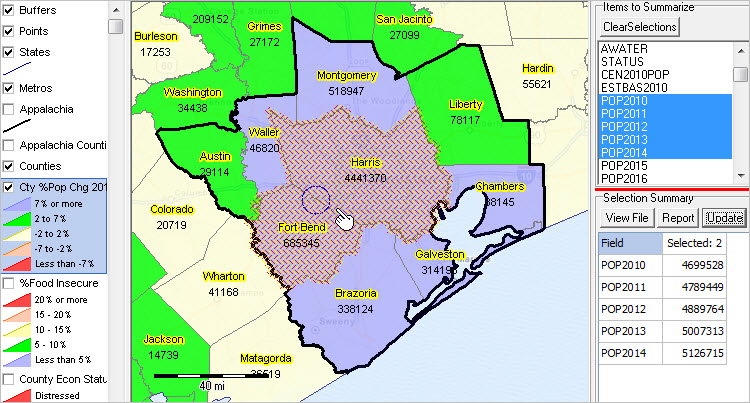 -- click graphic for larger view showing details. Patterns of Population Change -- %Change 2010-2014 -- Missouri Area Counties The following view shows patterns of %population change 2010-2014 using the CountyTrends layer/dataset. This view also illustrates use of the Metros layer to show outlines of Missouri metropolitan statistical areas (bold red/brown boundary). Counties are labeled with the 2014 population estimate. 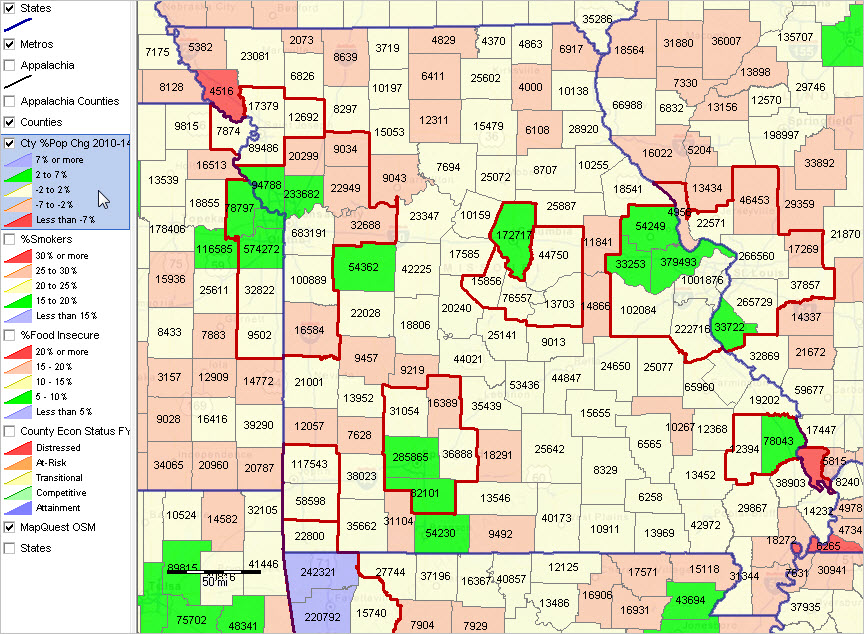 -- click graphic for larger view showing details. Patterns of Percent Smokers -- U.S. by County The following view shows patterns of percent smokers by county using the County Health Rankings RMD layer/dataset. 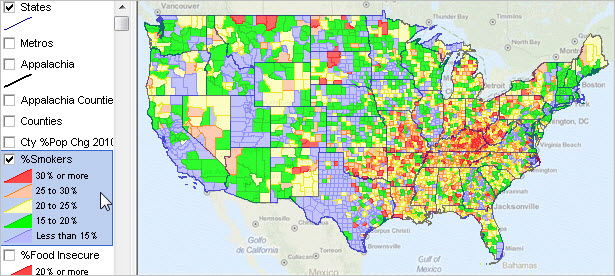 -- click graphic for larger view showing details. Patterns of Food Insecurity -- U.S. by County The following view shows patterns of food insecurity by county using the County Health Rankings AMD layer/dataset. 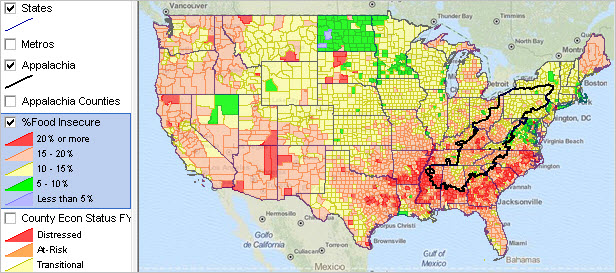 -- view created using CV XE GIS and associated county health GIS Project -- click graphic for larger view showing details. Patterns of Food Insecurity -- Appalachia Region The following view shows a zoom-in of the above view. 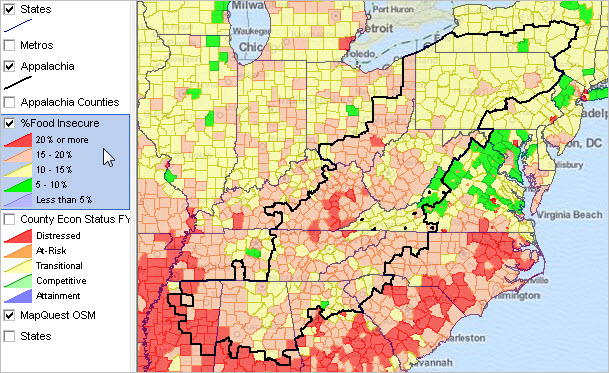 -- click graphic for larger view showing details. Patterns of Economic Distress -- Appalachia Region The following view shows patterns of economic distress based on an index developed by the Appalachian Regional Commission. 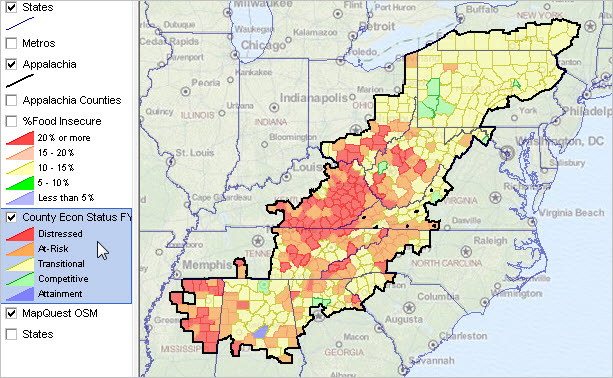 -- click graphic for larger view showing details. Supplemental Views SubCounty Geography -- Primary Care Service Areas (PCSA) ... focus on Appalachia -- bold boundary; PCSAs are comprised of one or more contiguous Census 2010 census tracts ... patterns of Crude Rate: Total number of Deaths per 1,000 Medicare beneficiaries residing in the PCSA ... this PCSA is located in Mingo County, WV and Pike County, KY. 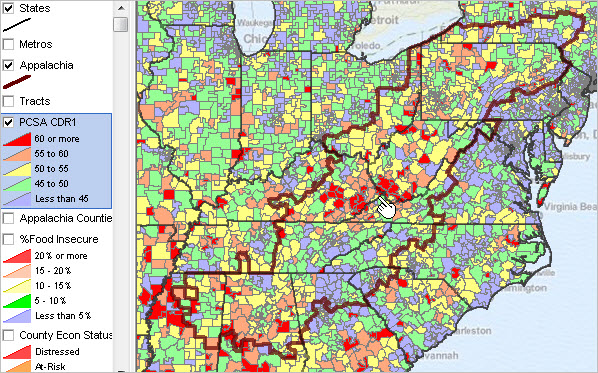 -- click graphic for larger view showing details. Supplemental Views SubCounty Geography -- Primary Care Service Areas -- Zoom-in ... focus on Appalachia -- bold boundary; PCSAs are comprised of one or more contiguous Census 2010 census tracts ... patterns of Crude Rate: Total number of Deaths per 1,000 Medicare beneficiaries residing in the PCSA ... zoom-in to pointer shown in above view ... pointer in following view in located in one PCSA shown in profile ... this is a multi-tract, multi-state PCSA 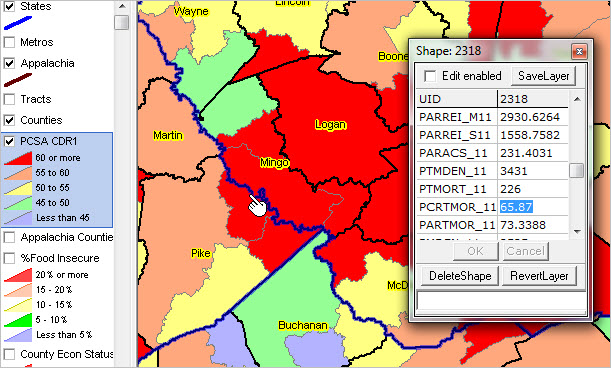 -- click graphic for larger view showing details. Supplemental Views SubCounty Geography -- Primary Care Service Areas -- Zoom-in -- Tract ... focus on Appalachia -- bold boundary; PCSAs are comprised of one or more contiguous Census 2010 census tracts ... patterns of Crude Rate: Total number of Deaths per 1,000 Medicare beneficiaries residing in the PCSA ... same view as above with census tract layer turned on. ... pointer in following view in located in one census tract shown in profile ... note census tract outline 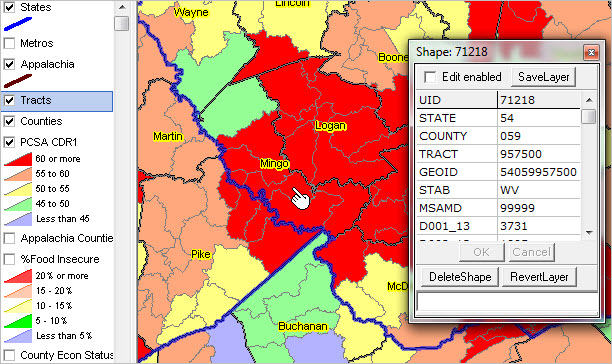 -- click graphic for larger view showing details. About the County Health Patterns GIS Project Use the County Health Patterns GIS Project to develop maps, such as those shown above, and perform geospatial analysis operations. Steps to develop custom thematic pattern maps are summarized below (requires Windows computer with Internet connection) 1. Install the ProximityOne CV XE GIS ... run the CV XE GIS installer ... take all defaults during installation 2. Download the County Health Patterns GIS project fileset ... requires User ID ... unzip County Health Patterns GIS project files to local folder c:\healthpatterns 3. Open the c:\healthpatterns\chp1.gis project ... after completing the above steps, click File>Open>Dialog ... open the file named c:\healthpatterns\chp1.gis 4. Done. The start-up view is shown above. About the Data & GIS Project The following scroll sections provide field names and subject matter descriptions for each of the shapefiles/datasets used in the GIS project. County Population & Components of Change -- scroll section; use scroll bar at right of table The following table lists items available in the ProximityOne County Trends dataset. Create thematic pattern map views of any of these items alone or in combination with other items. These fields are contained in project shapefile cb_2013_us_county_500k_countytrends.shp. Availability of 2015 estimates and projections to 2020 vary by version installed.
County Health Rankings "Ranked Measurement Data" (RMD) -- scroll section; use scroll bar at right of table The following table lists items available in the County Health Rankings RMD dataset. Create thematic pattern map views of any of these items alone or in combination with other items. These fields are contained in project shapefile cb_2013_us_county_500k_ch_rmd.shp. List of items shown below is also summarized starting on page 1 of this document.
County Health Rankings "Additional Measurement Data" (AMD) -- scroll section; use scroll bar at right of table The following table lists items available in the County Health Rankings AMD dataset. Create thematic pattern map views of any of these items alone or in combination with other items. These fields are contained in project shapefile cb_2013_us_county_500k_ch_amd.shp. List of items shown below is also summarized starting on page 3 of this document.
Appalachian Regional Commission Economic Status Data -- scroll section; use scroll bar at right of table The following table lists items available in the "County Economic Status in Appalachia, Fiscal Year 2016" dataset. Create thematic pattern map views of any of these items alone or in combination with other items. These fields are contained in project shapefile cb_2013_us_county_500k_arc.shp. The shapefile includes all counties but only those counties that are classified as Appalachia are population with subject matter fields/items 6 and above listed below. List of items shown below is also available in the excel file referenced here.
Support Using these Resources Learn more about demographic economic data and related analytical tools. Join us in a Data Analytics Web session. There is no fee for these Web sessions. Each informal session is focused on a specific topic. The open structure also provides for Q&A and discussion of application issues of interest to participants. ProximityOne User Group Join the ProximityOne User Group to keep up-to-date with new developments relating to geographic-demographic-economic decision-making information resources. Receive updates and access to tools and resources available only to members. Use this form to join the User Group. There is no fee. Additional Information ProximityOne develops geographic-demographic-economic data and analytical tools and helps organizations knit together and use diverse data in a decision-making and analytical framework. We develop custom demographic/economic estimates and projections, develop geographic and geocoded address files, and assist with impact and geospatial analyses. Wide-ranging organizations use our software, data and methodologies to analyze their own data integrated with other data. Follow ProximityOne on Twitter at www.twitter.com/proximityone. Contact ProximityOne (888-364-7656) with questions about data covered in this section or to discuss custom estimates, projections or analyses for your areas of interest. |
|
|