
|
|
|
CV XE GIS Start-up Project -- expanding insights through data analytics
May 9, 2016. The CV XE GIS start-up project, described in this section, is part of the CV XE GIS installer. The latest GIS project uses U.S. national scope shapefiles newly developed as of April 2016 and updated in May 2016. You can immediately start using this GIS project in a production manner. See more below. Join in the weekly Data Analytics Lab sessions where structure and use of this project and shapefiles are discussed. Keeping Up-to-Date It is recommended that existing CV XE GIS users re-install the CV XE GIS software. In addition to the new US1 GIS project, there are software updates. Software updates and related applications are reviewed in daily-to-weekly in the Data Analytics Blog focused on "Using CV XE GIS." Follow the blog to receive updates as they occur. CV XE GIS US1 Project Start-up View Click graphic for larger view. Expand browser window for best quality larger graphic viewing.  - View developed using CV XE GIS and related GIS project. Scope of US1 Project, Layers & Datasets The US1 GIS project includes these shapefiles/resources: • U.S. by State • U.S. by Combined Statistical Areas (CSA) - 166 CSAs .. added 5/9/2016 -- see more about CSAs included in this project • U.S. by Core-Based Statistical Area (CBSA) - 929 metropolitan areas • U.S. by County - 3,142 county areas • OpenStreetMaps Web-based tiling layer • each shapefile includes integrated Census 2010 population and annual population estimates 2010 through 2015. The states, metros and counties layers are all active upon start-up. States are transparent showing only boundaries. Metros/CBSAs reflect a query that has been set to show only the largest 10 metros (based on 2015 population). The county layer shows a thematic pattern map of the population percent change between 2010 and 2015. U.S 48-State County Population Change Thematic Pattern View The legend panel, shown below at left of map window, includes several layers as shown in the legend panel to left of map window. Five layers are checked on; this results in the layer being displayed in the map window. The metros and counties layers are included twice; the upper, unchecked, layer is set to show area names as labels.  Applications • Use the navigation tools to zoom to an area of interest. .. navigate to the Los Angeles area; create this view of the Los Angeles-Long Beach CSA, metros and counties. 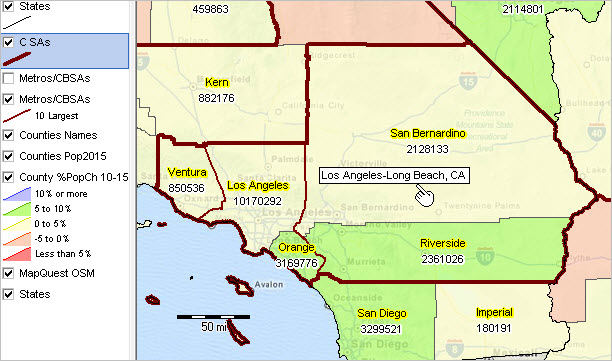 • Use layer editor tools to add labels, modify intervals/colors, change/add patterns and more. .. for example, check-on the county labels layer to easily view county names.. • Add other layers showing different types of geography and subject matter. • Integrate other types of subject matter into the existing shapefiles. ProximityOne User Group Join the ProximityOne User Group to keep up-to-date with new developments relating to data resources and data analytics. Receive updates and access to tools and resources available only to members. Use this form to join the User Group. Support Using these Resources Learn more about accessing and using demographic-economic data and related analytical tools. Join us in a Data Analytics Lab session. There is no fee for these one-hour Web sessions. Each informal session is focused on a specific topic. The open structure also provides for Q&A and discussion of application issues of interest to participants. Additional Information ProximityOne develops geodemographic-economic data and analytical tools and helps organizations knit together and use diverse data in a decision-making and analytical framework. We develop custom demographic/economic estimates and projections, develop geographic and geocoded address files, and assist with impact and geospatial analyses. Wide-ranging organizations use our tools (software, data, methodologies) to analyze their own data integrated with other data. Follow ProximityOne on Twitter at www.twitter.com/proximityone. Contact us (888-364-7656) with questions about data covered in this section or to discuss custom estimates, projections or analyses for your areas of interest. |
|
|