|
|
|
Native American Areas -- Geographic-Demographic-Economic Characteristics
As of Census 2010, the total population of America's 692 Native American areas was 4,849,548. These areas covered 49,194 square miles with a population of 98.6 persons per square mile. The total American Indian, Alaska Native and Native Hawaiian (one race alone) living in these areas was 981,513. Wide-ranging demographic-economic data for Native American geographic areas facilitate data-driven planning and analysis. By knowing about the demographic-economic characteristics of Native American areas, stakeholders are better able to understand and communicate about "where we are now" -- what is the situation now? -- for these areas. By examining these data over time, stakeholders can better see how these attributes are trending. By knowing about where we are and how things are trending, we can get a better picture of the future -- if matters continue with present trends. Successful data driven planning and analysis are grounded in use the same and preferred set of data resources. This common set of data enables analysts, policy makers, and stakeholders to develop plans for improved opportunities that have a better chance of reaching visions and targets. This section provides information about Native American area geographic-demographic-economic characteristics and trends. Use the interactive table provided in this section can be used to view, query, rank, compare characteristics of the Native American areas. About Native American Areas
Native American geographic areas are comprised of legal and statistical American Indian, Alaska Native, and Native Hawaiian areas.
Legal entities include federally recognized American Indian reservations and off-reservation trust land areas, tribal subdivisions that can divide these entities, state-recognized American Indian reservations, Alaska Native regional corporations and Hawaiian home lands. Statistical entities include Alaska Native village statistical areas, Oklahoma tribal statistical areas, tribal designated statistical areas and state designated tribal statistical areas. Statistical tribal subdivisions can exist within Oklahoma tribal statistical areas. In all cases, these areas are mutually exclusive in that no AIANNHA can overlap another tribal entity, except for tribal subdivisions, which by definition subdivide some American Indian entities, and Alaska Native village statistical areas, which exist within Alaska Native regional corporations. Where more than one tribe claims jurisdiction over an area, a joint-use area is defined as a separate entity. See this section for more detail about each of the AIANNHAs. Visual Analysis of Native American Areas Use Geographic Information System (GIS) tools and resources described here to create maps and geospatial analyses of these areas. Click graphic for larger view and details. Native American Areas Shown As Geographic Areas (polygons) The following view shows NAAs are the geographic areas they cover. 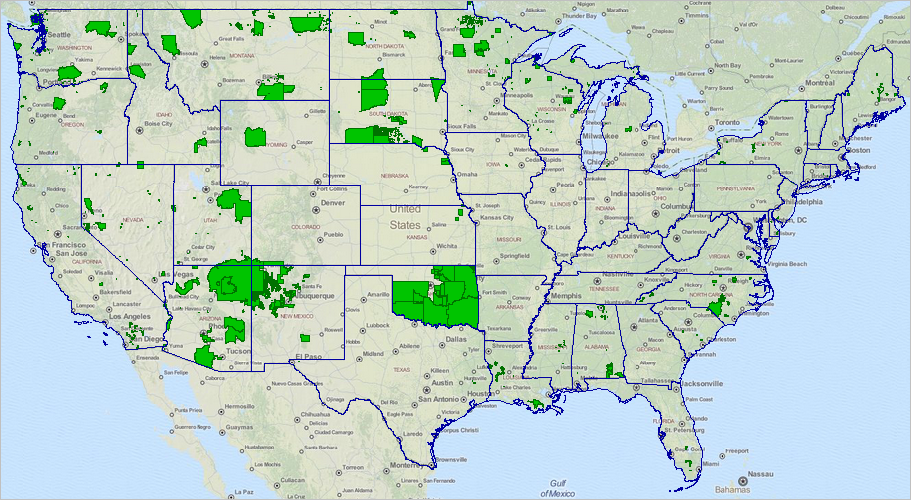
Native American Areas Shown As Markers (points) Many NAAs are geographically quite small. The following view shows NAAs as markers superimposed on NAAs as areas. 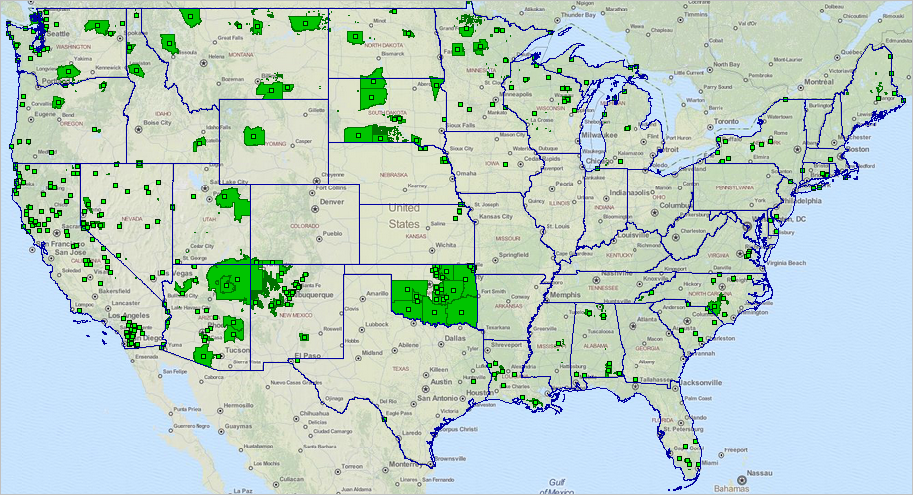
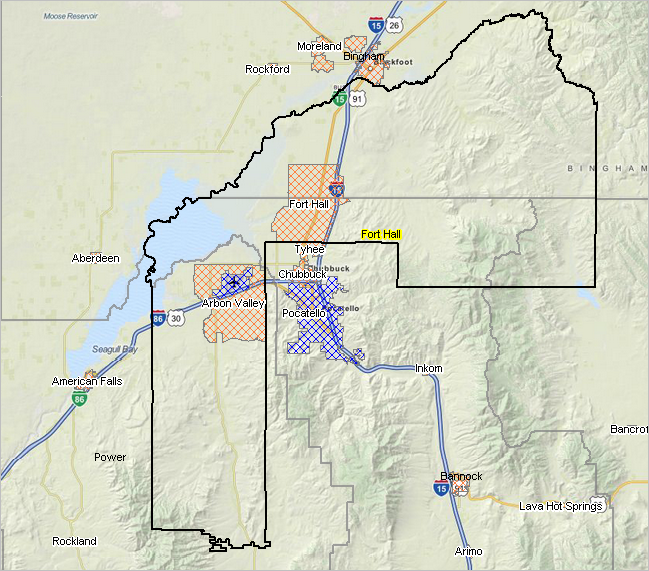
• Click this link to view Alaska NAAs • Click this link to view Hawaii NAAs Join the ProximityOne User Group to use this GIS project; view any school district(s) in the U.S.; add your own data; change colors, labeling, subject matter (join now, no fee). Data Resources Data in the interactive table are based on Census 2010 Summary File 1. All Native American areas (692) are included in the table. Many of these areas have zero population but exist as legally defined areas. Data from Summary File 1 are available down to the census block level. A map at upper right (1) is a thematic map shows the population by census block in the Fort Hall, ID reservation. Blocks are colored green where population is greater than zero; yellow for zero population blocks. GIS data and tools enable showing different types of geography in context of Native American areas. The map shown at upper right (2) shows cities/places (cross-hatched) in context with the Fort Hall reservation area. Additional richer demographic-economic data (e.g., income, education, housing value, employment, educational attainment, etc.) are available from the annually updated American Community Survey. As of this date (April 2014), the Census 2010 data provide the most accurate and up-to-date basic demographics for most Native American areas. Since most Native Americans areas have small populations, the ACS 5-year estimates must be used; the 2012 5-year estimates are centric to mid-2010. Using the Interactive Table -- an example To view the Hawaiian Home Lands ranked in descending order by total population, proceed as follows. Click ShowAll button below table ... use the Type dropdown below table to choose 78 -- Hawaiian Home Lands (table now shows only Hawaiian Home Lands -- refresh page may be necessary for some browsers) ... navigate to table column/header cell Population and dbl-click that cell. The largest Hawaiian Home Land area shows as Nanakuli HHL (top row in table) with Census 2010 total population of 5,330. 44% of the population in this HHL are Native Hawaiian (one race alone). Native American Area Interactive Table -- selected geographic-demographic characteristics Click ShowAll button between Find/Queries. Use mouseover on column header to view column description. See ranking table usage notes below ranking table. See related ranking tables -- http://proximityone.com/rankingtables.htm. Usage Notes • All items are based on Census 2010 Summary File 1 and Census 2010 TIGER. • Click ShowAll button between specific area queries. • Cells with -1 value are not available. Additional Information ProximityOne develops geographic-demographic-economic data and analytical tools and helps organizations knit together and use diverse data in a decision-making and analytical framework. We develop custom demographic/economic estimates and projections, develop geographic and geocoded address files, and assist with impact and geospatial analyses. Wide-ranging organizations use our tools (software, data, methodologies) to analyze their own data integrated with other data. Follow ProximityOne on Twitter at www.twitter.com/proximityone. Contact us (888-364-7656) with questions about data covered in this section or to discuss custom estimates, projections or analyses for your areas of interest. |
|
|