|
|
|
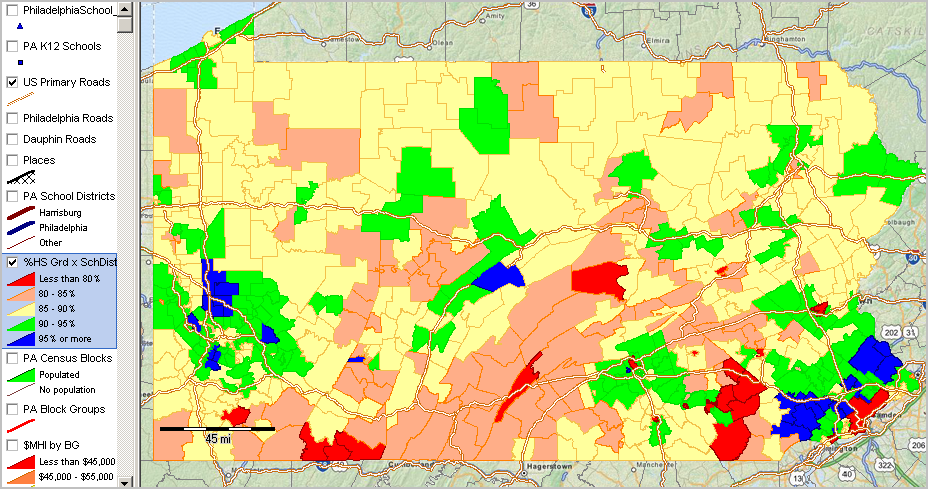
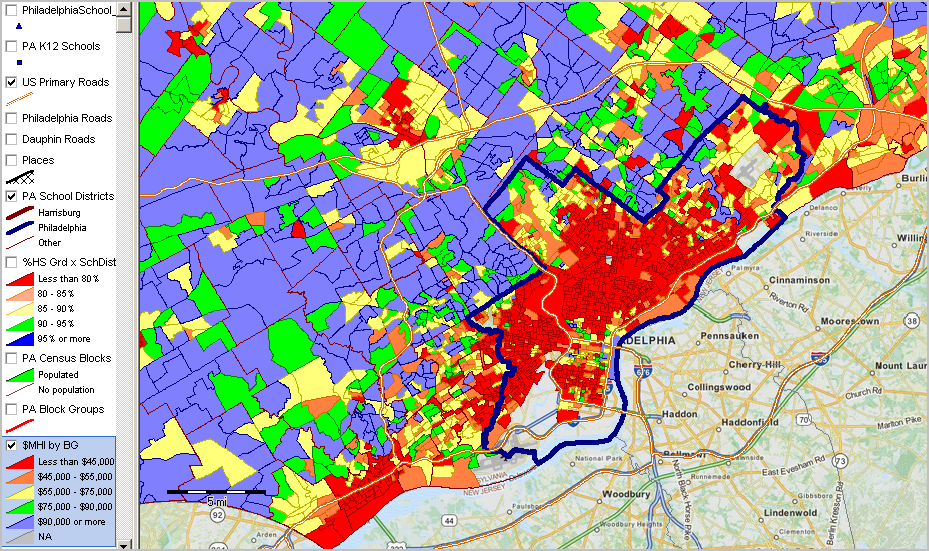
Pennsylvania Demographic-Economic Patterns This section features demographic-economic pattern analysis views focused on Pennsylvania schools, school districts and communities developed using the CV XE GIS tools and data resources. Check back for new map graphics and videos added periodically. Percent High School Graduate by School District ... scroll section See highlighted layer in legend panel at left for color/interval/values. More about school district community. Data based on ACS 2011 estimates.  Median Household Income by Block Group ... scroll section See highlighted layer in legend panel at left for color/interval/values. More about block group demographics. Data based on ACS 2011 estimates.  Additional Information ProximityOne develops geographic-demographic-economic data and analytical tools and helps organizations knit together and use diverse data in a decision-making and analytical framework. We develop custom demographic/economic estimates and projections, develop geographic and geocoded address files, and assist with impact and geospatial analyses. Wide-ranging organizations use our tools (software, data, methodologies) to analyze their own data integrated with other data. Follow ProximityOne on Twitter at www.twitter.com/proximityone. Contact ProximityOne (888-364-7656) with questions about data covered in this section or to discuss custom estimates, projections or analyses for your areas of interest. |
|
|