
|
|
|
-- examining Census Bureau Vintage 2024 Population & Components of Change -- assessing Population & Components of Change projections 2025 through 2030 The Federal government does not produce county level projections. The Census Bureau produces county population estimates (vintages) annually, released in March. The 2024 Vintage estimates (2020 through 2024) are used in other programs such as the 2024 American Community Survey. In 2025, the most current vintage is the 2024 Vintage which will be updated/revised in March 2026, and referred to as the 2025 Vintage. The Situation & Outlook Estimates & Projections (SOEP) tool can ne used on a Windows computer to develop and examine county level projections annually to 2030 or 2060. This section provides an overview of the tool and an introduction to its use. How to Install and Operate .. install the program and data on a Windows computer into empty folder c:\soep (unzip two files) .. review terms of use; requires userid and password .. start the program c:\soep\soep.exe; optionally make shortcut .. see details Start-up View .. click for larger view 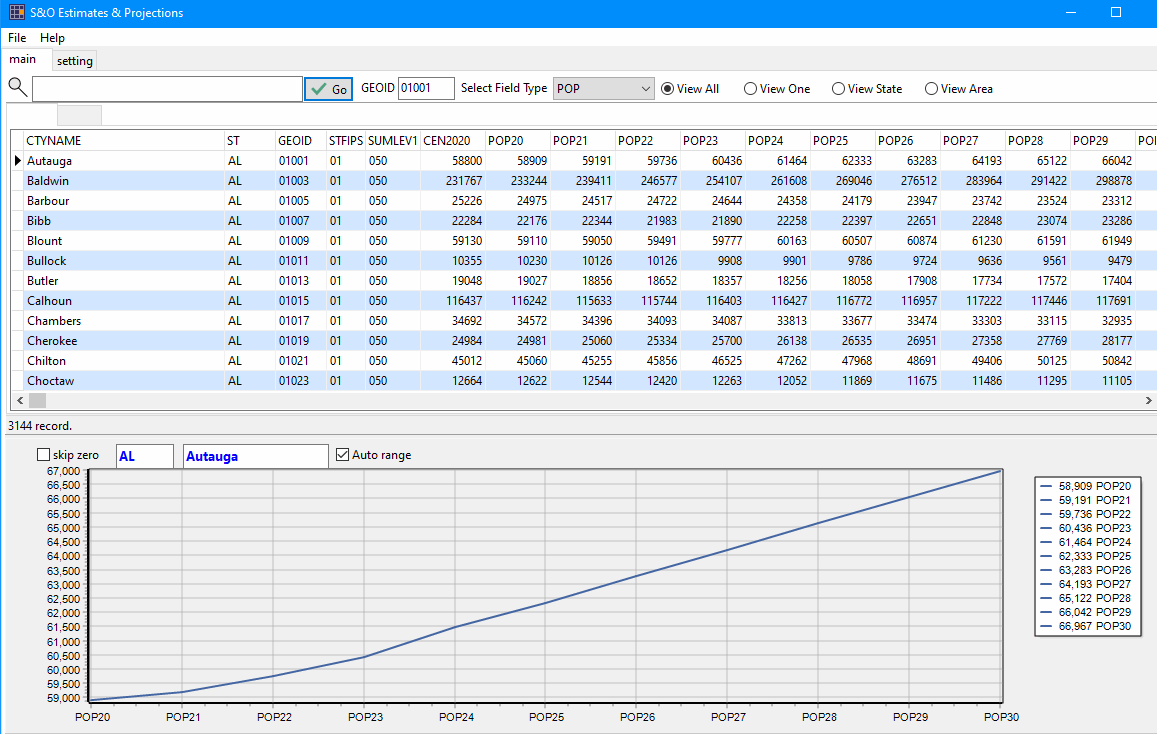 Profile View of How Kaufman County, TX is Changing; 2020-2030 .. the fastest growing county 2020-2030 in the U.S. based these projections. .. click for larger view 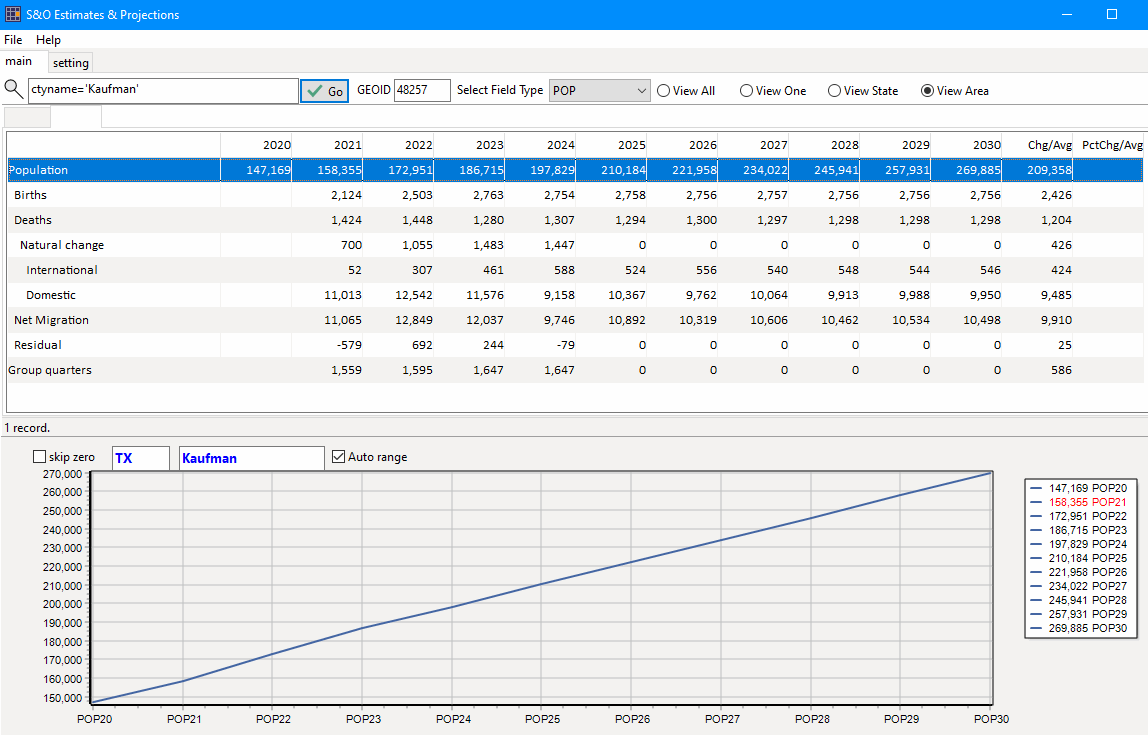 The S&O estimates and projections tool has been developed and is maintained by Warren Glimpse, ProximityOne (Alexandria, VA) and Takashi Hamilton, Tsukasa Consulting (Osaka, Japan). Join the Weekly Web Sessions. Learn more about key topics. No cost. See topics and connectivity details; Tuesday, Wednesday and Thursday at 3:00 pm ET. Learn how to use the S&O estimates and projections tool. Using iVDA with the VDA Project .. goto top .. The starting view shows the lower 48 states by county. .. see more about this project at https://proximityone.com/vda_dp.htm Two layers focused on the 2020-2030 projections use the same shapefile: • County Pop 2020-2030 -- the population change 2020 to 2030 • County Pop 2020-2030 Pct -- the population percent change 2020 to 2030 Use the Tools>Layer Editor to modify either layer; e.g. show the population percent change 2020 to 2030 as a label. View the "County Pop 2020-2030 Pct" with these four steps: .. uncheck the "County Annual Population" layer .. check on the "County Pop 2020-2030 Pct" layer .. expand the "County Pop 2020-2030 Pct" layer legend .. zoom to areas of interest Viewing Kaufman County, TX with iVDA and VDA GIS project .. the fastest growing county 2020-2030 in the U.S. based these projections. 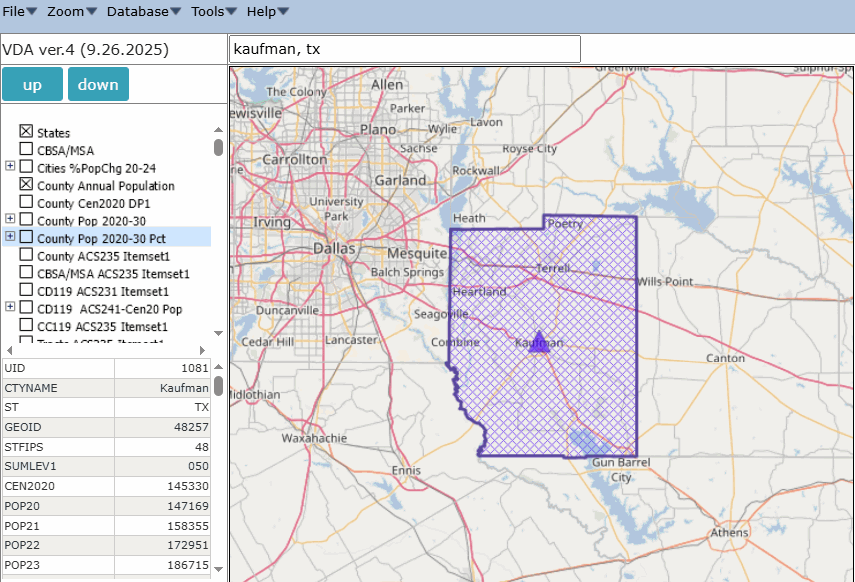 Details of Operation go to top Methodology & Vintages go to top Demographic projections presented in this section are developed using an annual time series model. The population in period t (P[t]) for a county is defined/projected using the identity: P[t]:=P[t-1]+B[t]-D[t]+IM[t]+DM[t], where: - P[t] -- resident population as of 7/1/t - P[t-1] -- resident population as of 7/1/t - B[t] -- births during the period 6/30/t-1 to 7/1/t - D[t] -- deaths during the period 6/30/t-1 to 7/1/t - IM[t] -- international migration during the period 6/30/t-1 to 7/1/t - DM[t] -- domestic during the period 6/30/t-1 to 7/1/t • Projections are developed as vintages (released on a certain date). • County projections are developed annually and are updated in March and July .. the July update integrates updated age, race/origin and gender detail .. data presented in the table are extracts showing total population every 10 years .. the underlying dataset includes annual data for many items used in the model • Projections are developed for various scenarios. .. the option 2 scenario uses these assumptions: .. crude birth rate declines over time .. crude death rate increases over time .. migration follows patterns exhibited during the period 2010-2020 .. historical annual data for the period 2010 through 2020 use Census Bureau estimates .. some counties are adjusted for specific circumstances • Different model specifications and vintages will have different projected values. Terms of Use .. goto top The Situation & Outlook Estimates & Projections (SOEP) tool is available for the exclusive use of the ProximityOne User Group members. The SOEP tool may not be redistributed. There are no warranties for any aspect of SOEP tool. ProximityOne User Group .. goto top Join the ProximityOne User Group to keep up-to-date with new developments relating to metros and component geography decision-making information resources. Receive updates and access to tools and resources available only to members. Use this form to join the User Group. Support Using these Resources Learn more about accessing and using demographic-economic data and related analytical tools. Join us in a Web session. There is no fee for these one-hour Web sessions. Each informal session is focused on a specific topic. The open structure also provides for Q&A and discussion of application issues of interest to participants. Additional Information ProximityOne develops geodemographic-economic data and analytical tools and helps organizations knit together and use diverse data in a decision-making and analytical framework. We develop custom demographic/economic estimates and projections, develop geographic and geocoded address files, and assist with impact and geospatial analyses. Wide-ranging organizations use our tools (software, data, methodologies) to analyze their own data integrated with other data. Contact us (888-364-7656) with questions about data covered in this section or to discuss custom estimates, projections or analyses for your areas of interest. |
|
|