|
|
|
County Migration Main Situation & Outlook - S&O Desktop - S&O Server - S&O Profiles|Reports > Comparative > Narrative > Site Analysis CVXE GIS Tools Data Resources Guide - projections to 2060 Related Sections - Applications Gallery - States - Congressional District - School Districts - Counties - Cities/Places - Tracts/Neighborhoods - Block Groups - Census Blocks - ZIP Codes - Urban Areas Demographic-Economic Estimates-Projections GIS Thematic Mapping Visual Analysis Tools Ranking Tables National Scope Demographic Change 2000-2010 - States - Metros - Congressional District - School Districts - Counties - Cities/Places - Census Tracts |
County to County Migration Characteristics
An average of approximately 130,000 people move every day in the U.S. Based on the American Community Survey 2010 5-year estimates data, 47.3 million people lived in a different house a year earlier and 17.3 million of them lived in a different county within the U.S. County to County Migration Profiles. Data presented in the interactive table are also used to develop county to county migration profiles. These profiles show movers-in, movers-out and net movers by county/area of residence one year ago. See sample profiles: San Diego, CA ... Honolulu, HI. Contact us for a profile for a county of interest. This section provides an example of using the County to County Migration Flows Interactive Table (http://proximityone.com/county_migration.htm) to examine characteristics of movers to and from Honolulu County, Hawaii. Migration to Honolulu County After the table populates (http://proximityone.com/county_migration.htm), key-in the Honolulu County State+County FIPS code 15003 in the edit box to the right of the "Find in CR Code" button below the table -- illustrated below. Find county code for any county located in a scroll section lower down on the main page. 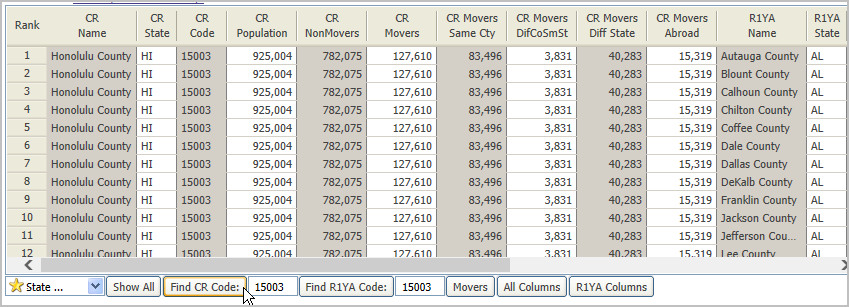
Click the "Find in CR Code" button. Next click the "Movers" button. The next view appears. 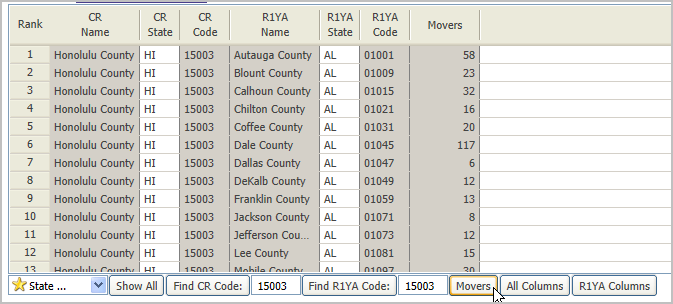
Dbl-click the Movers column header cell to sort this set of rows on the number of movers in descending order. The next view appears. This view shows that the largest source of in-migration from abroad or a county was from Asia. 9,742 persons are estimated to move from Asia countries to Honolulu County. The estimate is centric to mid-2008. The next largest source of in-migration from abroad or a county was from Hawaii County (2,217), and so on. 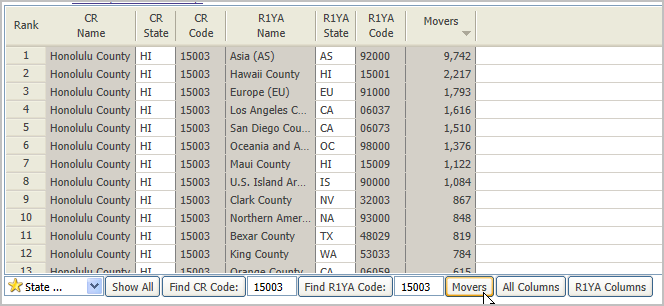
Migration from Honolulu County Click the ShowAll button below the table to reset the view. Follow similar steps as above but key-in the Honolulu County State+County FIPS code 15003 in the edit box to the right of the "Find in R1YA Code" button below the table. Click the "Movers" button. Next dbl-click the Movers column header cell. The next view shows that the county with the largest estimated number of movers from Honolulu County was to San Diego, CA (2,402). The estimated movers from Honolulu County to Hawaii County is 1,458. 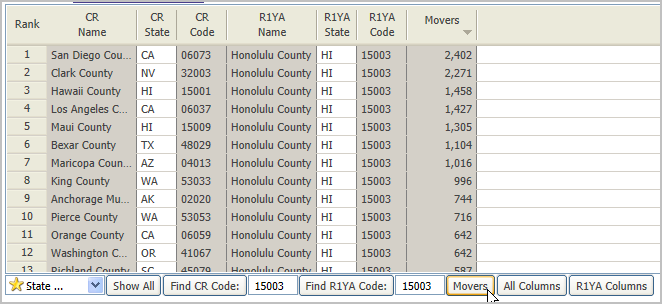
Net Domestic Migration To recap ... - the estimated movers from Hawaii County to Honolulu County is 2,217. - the estimated movers from Honolulu County to Hawaii County is 1,458. - the estimated Hawaii County to Honolulu County net migration is 759. The difference between Honolulu County and San Diego County was an estimated 892 net outbound movers -- 2,402 from Honolulu to San Diego and 1,510 from San Diego to Honolulu. Apply similar steps to example migration patterns among any set of counties. Additional Information ProximityOne develops geographic-demographic-economic data and analytical tools and helps organizations knit together and use diverse data in a decision-making and analytical framework. We develop custom demographic/economic estimates and projections, develop geographic and geocoded address files, and assist with impact and geospatial analyses. Wide-ranging organizations use our tools (software, data, methodologies) to analyze their own data integrated with other data. Follow ProximityOne on Twitter at www.twitter.com/proximityone. Contact ProximityOne (888-364-7656) with questions about data covered in this section or to discuss custom estimates, projections or analyses for your areas of interest. |
|
|