|
|
|
- S&O Desktop - S&O Server - S&O Profiles|Reports > Comparative > Narrative > Site Analysis CVXE GIS Tools Data Resources Guide - projections to 2060 Related Sections - Applications Gallery - States - Congressional District - School Districts - Counties - Cities/Places - Tracts/Neighborhoods - Block Groups - Census Blocks - ZIP Codes - Urban Areas Demographic-Economic Estimates-Projections GIS Thematic Mapping Visual Analysis Tools Ranking Tables National Scope Demographic Change 2000-2010 - States - Metros - Congressional District - School Districts - Counties - Cities/Places - Census Tracts |
Demographic Characteristics of the Population Age 65 & Over
This section is updated/expanded over time. Soon an interactive ranking table will be added to examine population by 65 years, 75 years and 85 years and over by county. Topics will be extended in areas including population and general demographics, economic, health status, health risks and behavior, health care, end of life and other topics.
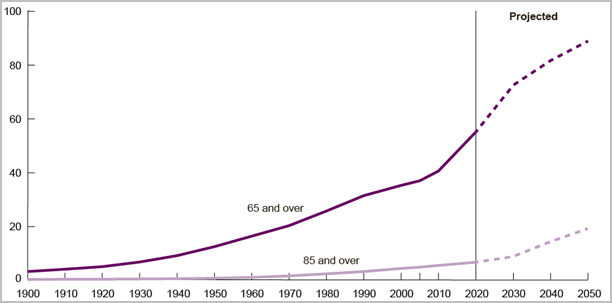
In 2010, 40 million people age 65 and over lived in the U.S.; 13 percent of the total population. This population grew from 3 million in 1900 to 40 million in 2010. See trend line chart at right. Those age 85 and over grew from just over 100,000 in 1900 to 5.5 million in 2010. The population 65 and over will increase dramatically during the 2010�2030 period; by 2030 this population will be twice as large 2000 counterparts, growing from 35 million to 72 million (representing 20% of the total U.S. population). The 65 and over population growth rate will slow after 2030 with the last of the Baby Boomers. From 2030 forward, the proportion age 65 and over will be stable at around 20%, though the number of people age 65 and over will to continue to grow. The population 85 years and over will grow rapidly after 2030, when Baby Boomers move into this group. Earlier Census projections show the population age 85 and over could grow from 5.5 million in 2010 to 19 million by 2050. Death rates at older ages will decline more rapidly than reflected in the Census Bureau projections which could lead to faster growth of this population. Updating Projections. Projections of the population 65 years and over are included in Outlook 2060. The Outlook 2060 projections will be released in mid-December 2012. For more information, see http://proximityone.com/outlook2060.htm.
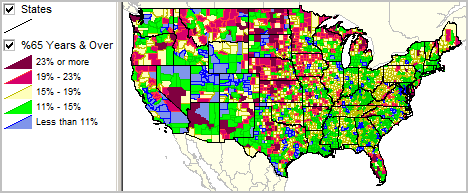
The map at the right shows the percent population age 65 and over by county. Counties in dark red have the highest percentages; counties in light blue have the lowest percentages; See the percent 65 years and over interval/color relationship in legend at left of map. Use GIS Project on Your Computer. Download and use the GIS project used to prepare this map view (no fee for software or GIS project resources). Examine wide-ranging map view and data variations, such as number 65 years and over, percent/number 65 years and over by gender, percent/number 75 years and over, percent/number 85 years and over, etc. Integrate your own data. See details. Additional Information Proximity develops geodemographic-economic data and analytical tools and helps organizations knit together and use diverse data in a decision-making and analytical framework. We develop custom demographic/economic estimates and projections, develop geographic and geocoded address files, and assist with impact and geospatial analyses. Wide-ranging organizations use our tools (software, data, methodologies) to analyze their own data integrated with other data. Contact Proximity (888-364-7656) with questions about data covered in this section or to discuss custom estimates, projections or analyses for your areas of interest. |
|
|