
|
|
|
Healthcare Analytics & Market Analysis
Analyzing healthcare markets involves examining characteristics of healthcare facilities in context of competitive position and market potential. Geographic Information System (GIS) tools can be used to knit together geographic, demographic, economic and business data to perform these analyses. This document makes use of the Atlanta area to illustrate applications. In an actual study, the geographic focus could be a city, county, metro, state or some combination, anywhere in the U.S., or the U.S. overall. Understanding Your Needs and Visions A first step involves an assessment of your situation -- your needs, visions and data that you have to work with. The results of this assessment and data that you provide help develop/frame a market study in context of GIS project(s). Framing a Market Study Here is an example of framing a market study for the Atlanta area. The following graphic shows the start-up view of the Atlanta area HCMS GIS project. This is a proxy/example for the GIS project that would be developed to meet your needs/application focus. 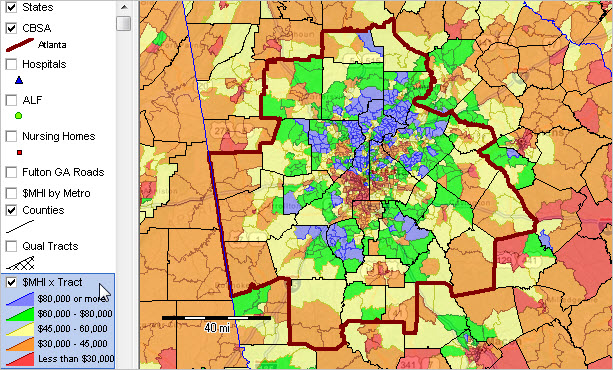 The above view shows a thematic pattern of median household income by census tract (averaging 4,000 population). Pattern analysis helps you visualize demographic-economic characteristics by census tract -- in this example you can easily see patterns of economic prosperity. This example uses median household income; we can draw upon hundreds of subject matter items and depict other types of patterns Counties are easily identified by adding county name labels: 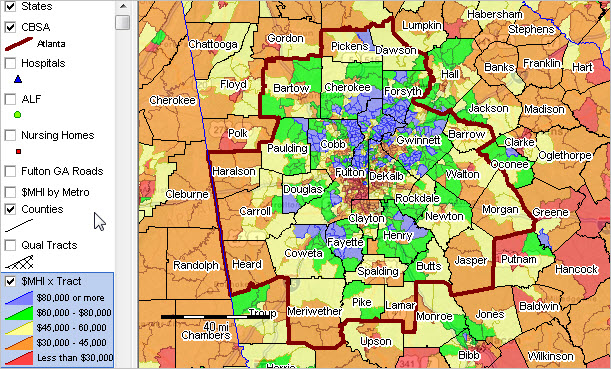 Examining the Healthcare Infrastructure The graphic below shows selected types of healthcare facilities. See legend to the left of map: • Hospitals - blue triangle markers • Assisted Living Facilities (ALF) - green circle markers • Nursing Homes - red square markers 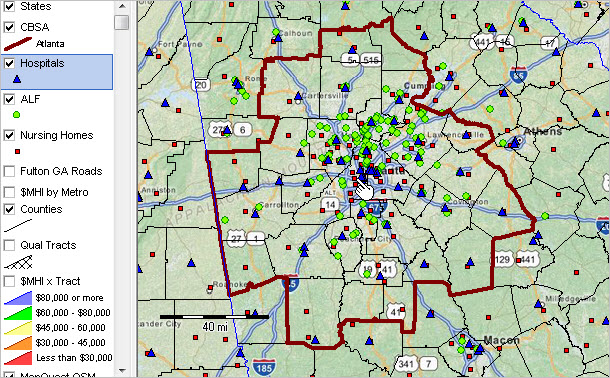 The next graphic shows a zoom-in to the area shown near pointer in the above view. Note that the "qualified tracts" layer (see in legend to left of map) appears in the map. Zooming to this level of geography is required to analyze characteristics of the market served. 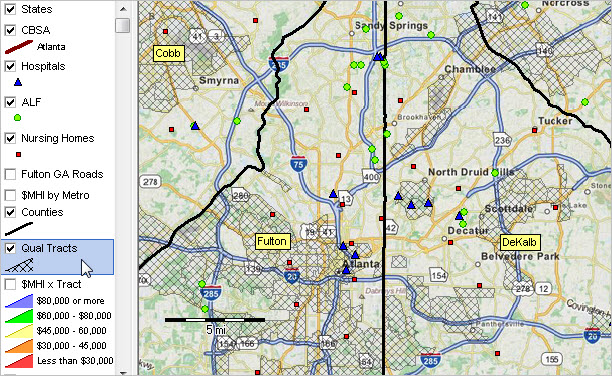 Site Analysis -- Examining Characteristics of Healthcare Facilities The yellow circle marker shows the hypothetical location of a prospective new facility. 5-mile radius around yellow marker -- selecting existing nursing homes; characteristics of the competition. Nursing homes show as cross-hatched; circular area is study zone. 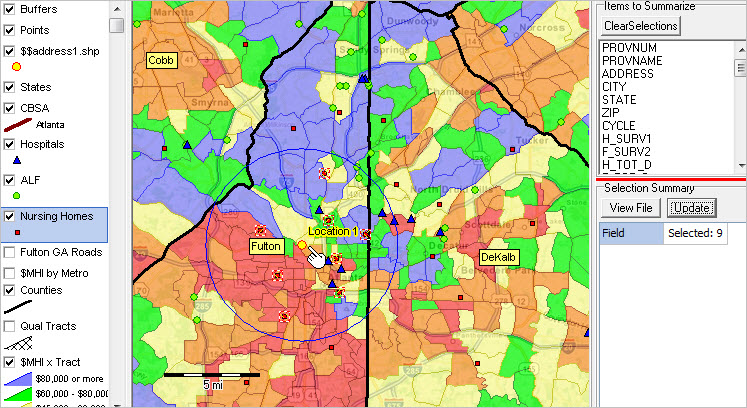 Display of the 9 facilities selected above. 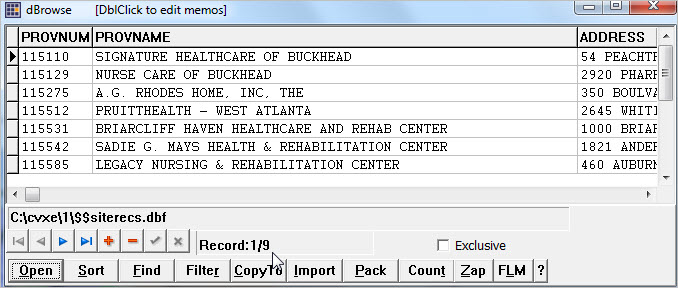 Site Analysis -- Examining Characteristics of Market/Service Area 5-mile radius around yellow marker -- size of market; tracts in market area; might be 15 miles rather than 5. Tracts selected show as cross-hatched; circular area is study zone. 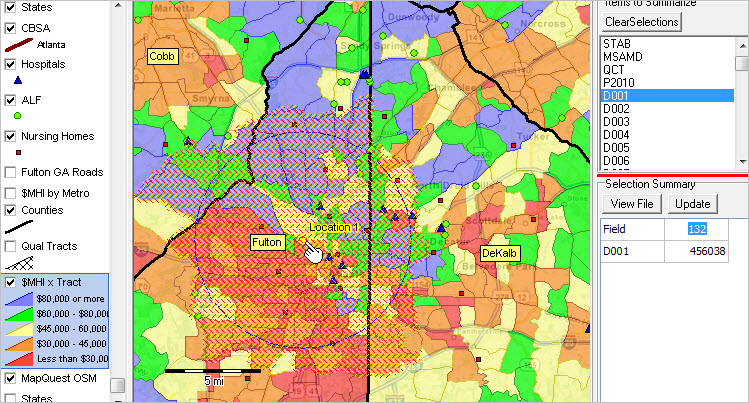 Display of the selected 133 tracts by attribute. 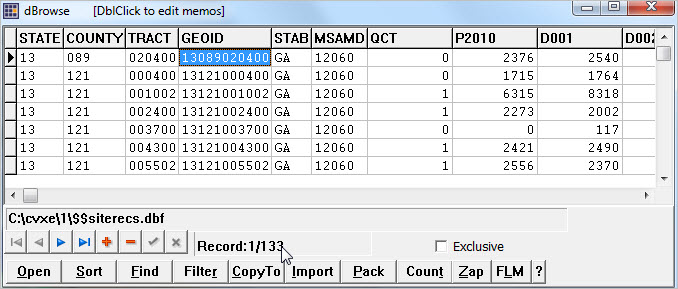 Demographic-Economic Characteristics of the Study Area The analytical framework needs to draw on extensive data resources and adapt them to the needs of the study. • Atlanta Metro Profile (available for each metro) • Atlanta City Profile (available for each city) • Census Tracts: General Demographics .. Social Characteristics .. Economic Characteristics .. Housing Characteristics • Outlook 2020 -- demographic projections by county and tract • .. among many others such as more detailed data about the work force. Additional Information ProximityOne develops geographic-demographic-economic data and analytical tools and helps organizations knit together and use diverse data in a decision-making and analytical framework. We develop custom demographic/economic estimates and projections, develop geographic and geocoded address files, and assist with impact and geospatial analyses. Wide-ranging organizations use our tools (software, data, methodologies) to analyze their own data integrated with other data. Follow ProximityOne on Twitter at www.twitter.com/proximityone. Contact ProximityOne (888-364-7656) with questions about data covered in this section or to discuss custom estimates, projections or analyses for your areas of interest. |
|
|