
|
|
|
.. using vector-based geographic data with global topology VDAGIS tools provide integrated access to OpenStreetMap (OSM). OSM is a collaborative project to create/maintain a free editable map of the world. The OSM Internet-based map resource is built by a community of people who contribute and maintain data about roads, local geography and much more, all over the world. GIS Applications Linking/Combining Shapefiles with OSM This section illustrates viewing political/statistical geography in context of streets/roads shapefiles and/or Web-based street/ground coverage graphics. When using GIS tools to view census tracts (as one example) rendered through the use of shapefiles, there is often no convenient way to view the boundaries in context of roads/ground cover. There are two alternatives. One option is to add a layer using the corresponding streets/roads shapefile. This option has important features but is often difficult, time-consuming or not feasible as the roads shapefile coverages are organized in county units. Also roads shapefiles provide only part of the picture with respect to ground coverage. A second option is to use Web-based roads/ground coverage tiling services such as OpenStreetMap. Both options are reviewed here. The CV XE GIS software is used to view a census tracts shapefile/layer in context with 1) roads shapefile/layer and 2) Web-based OpenStreetMap (OSM) layer via OSM WMS (OGC Web Map Service). CV XE GIS supports the OGC WMS standard, which means that it can be used to open map layers from any properly functioning WMS server, including OSM WMS servers. Use of the OSM shown here is available at no cost and has global coverage. Tiling graphics are courtesy of MapQuest. Get Started Now No registration or fees are required to use the CV XE GIS software with OSM. Run the CV XE GIS installer on a Windows-based computer and create views/applications such as those shown below. Make custom maps of your neighborhood or a city/country anywhere in the world. Examining Optional Views (scroll section) While the focused is on census tracts it applies equally to any political/statistical geography.
1- Study Area -- Jackson County, MO (see pointer)
U.S. by County shapefile layer (with labels) superimposed on OSM layer 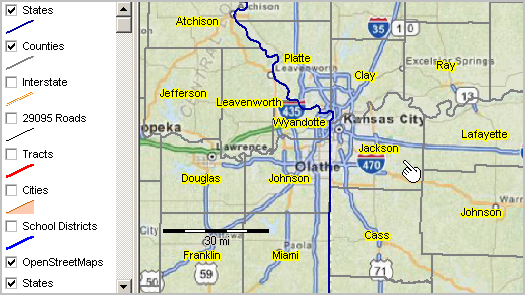
2 - Zoom-in to Jackson County showing tracts shapefile/layer (red boundary) superimposed on roads shapefile/layer (gray lines); OSM checked off 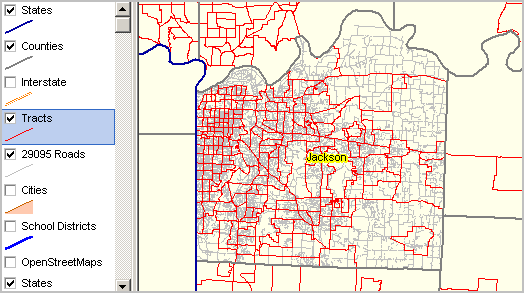
3 - Jackson County tracts shapefile/layer (red) superimposed on OSM Roads shapefile/layer checked off; pointer at tract 29-095-007400 (next view) 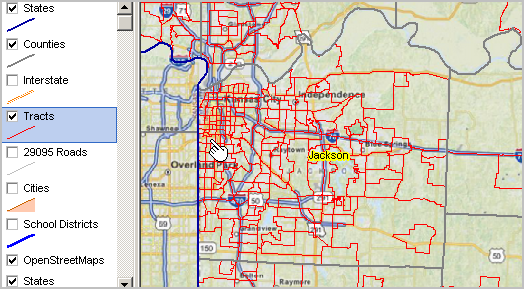
4 - Zoom-in to tract 29-095-007400 (red) with superimposed roads OSM checked off 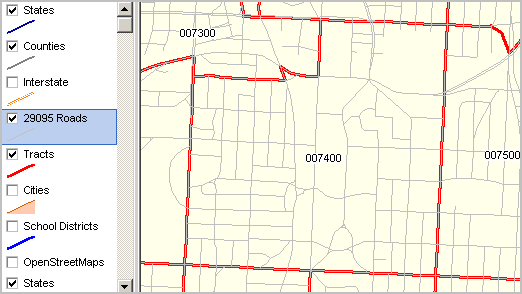
5 - View as above with roads labels on; Illustrates using Identify tool to profile a road segment Address range & ZIP code on each side of segment visible 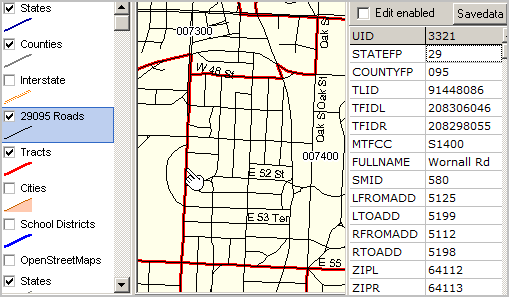
6 - View as above; OSM checked on This combination offers most features/capabilities 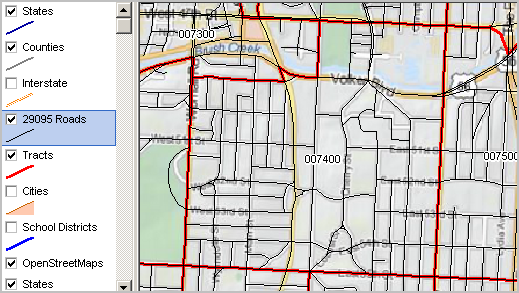
7 - View as above; roads checked off; OpenStreetMap checked on With OSM only, we are unable to label all roads or click to profile a road 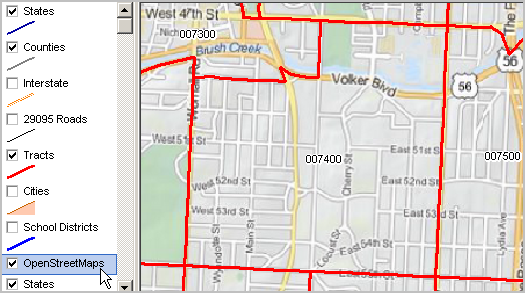
8 - Panning/sliding map north to adjacent county Roads are not available unless another shapefile layer added However, with OSM checked on we are able to view roads/groundcover 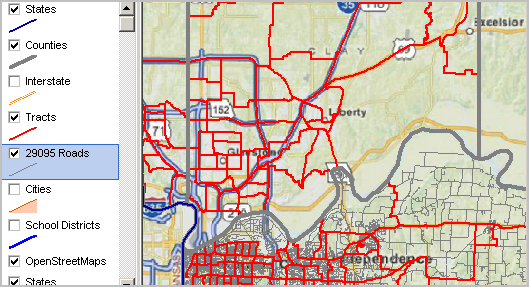
9 - Zooming in to above view; street/groundcover detail available from OSM ... but no road vectors A further limitation of OSM is with thematic mapping applications. Roads layers can be superimposed on thematic maps but there is no way to visually inetgrate OSM views. 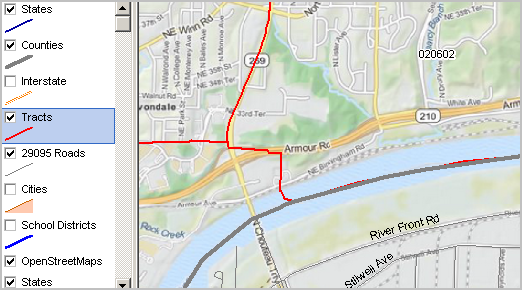
Support Using these Resources Learn more about accessing/using geographic, demographic, economic data and related analytical tools. Join us in a Data Analytics Lab session. There is no fee for these one-hour Web sessions. Each informal session is focused on a specific topic. The open structure also provides for Q&A and discussion of application issues of interest to participants. ProximityOne User Group Join the ProximityOne User Group to keep up-to-date with new developments relating to geographic-demographic-economic decision-making information resources. Receive updates and access to tools and resources available only to members. Use this form to join the User Group. Additional Information ProximityOne develops geographic-demographic-economic data and analytical tools and helps organizations knit together and use diverse data in a decision-making and analytical framework. We develop custom demographic/economic estimates and projections, develop geographic and geocoded address files, and assist with impact and geospatial analyses. Wide-ranging organizations use our tools (software, data, methodologies) to analyze their own data integrated with other data. Follow ProximityOne on Twitter at www.twitter.com/proximityone. Contact ProximityOne (888-364-7656) with questions about data covered in this section or to discuss custom estimates, projections or analyses for your areas of interest. |
|
|