
|
|
|
This section is focused on CV XE GIS operations using business patterns and related data. It builds on topics reviewed in main business patterns section. It is assumed that the reader has installed the software and data described in that section. This section is not intended to tell you where to locate a store, how to increase sales, how to more successfully operate a business or other similar topics. Rather, it is focused on how you can use tools and data to address those types of questions and develop, organize and use data driven methods that relate to those business planning needs. Key Types of Business Analytics Questions What are the current business composition patterns -by area? How are patterns of business composition changing - by area? How are patterns of markets served by these businesses changing - by area? How will these patterns change in the future? How does Area1 relate to Area2 relative to above topics? Business Data Analytics Topics Topics using the CV XE GIS software with the business patterns data include: 1. Mapping Operations .. creating business patterns reference and thematic pattern maps 2. dBrowse Operations .. viewing/processing business patterns data using the dBrowse feature 3. Business Patterns Operations .. creating business patterns profiles and reports 1. Mapping Operations Mapping operations reviewed here are supported using any version of CV XE GIS and use tools and data as described and installed in the main business patterns section. Patterns of Supermarket Establishments by County The following graphic shows patterns of the number of supermarket establishments by county for the Houston metro (bold boundary) region. Counties are labeled with the number of supermarkets and county name. Number of supermarkets shown by intervals/colors as depicted in legend panel at left of map window. Create custom maps similar to this view for your regions of interest depicting establishments, employment or payroll for your type of business selection(s). Click graphic for larger view with more detail; expand browser window for best quality view. 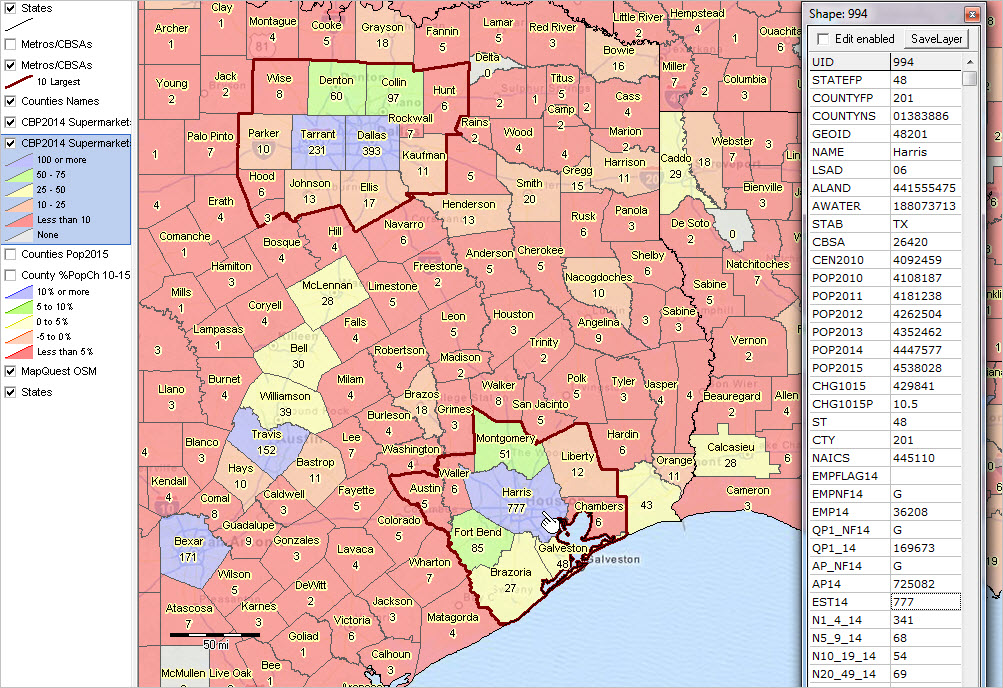 View developed with CV XE GIS software using the US1_CBP14 GIS project. The start-up view of the CV XE GIS "us1_cbp14.gis" GIS project is shown above. Use of this project is introduced in the main business patterns section. This GIS project has a structure similar to the default "us1.gis" GIS project distributed with the CV XE GIS installer. The differences are the addition of the two layers "CBP2014 ..." which are both assigned to the U.S. by county shapefile (cb_2015_us_county_500k_cbp14.*) with integrated NAICS 445100 CBP14 data. Two CBP2014 layers are used as a convenience. The upper layer has no queries applied and has the county name turned on as a label. Clicking this layer on or off makes it easy to label counties. The counties could be labeled with an different items, such as GEOID or number of establishments. The lower layer is used to depict the thematic patterns -- in this case the number of establishments. An additional layer might be added that would show patterns of employment, payroll, an index, percent or some combination of items. Steps are described in the main business patterns section as to how this shapefile can be populated with data for other industry sectors. The CBP14 dataset contains a record for each NAICS level for which data are tabulated for the corresponding county. There is at least one record for every county. Most oounties have a few hundred NAICS records. The structure of the shapefile is "flat" in the since that there is one DBF record for each geographic area (county in this case). To develop thematic maps for other NAICS industries, those data must be integrated into the shapefile DBF using the CV XE GIS dBMerge operation. dBMerge is a generalized data integration tools. As a result, it is possible to integrate data for several NAICS codes or multiple years. For example, 2. dBrowse Operations The dBrowse operations make use of the Database>dBrowse feature. Database operations reviewed here are required the CV XE GIS Basic or Pro version and use tools and data as described and installed in the main business patterns section. Use of dBrowse with the NAICS codes data and the CBP data are illustrated below. dBrowse is a general purpose dBASE file (dbf or DBF extension) manager. It is not specialized with respect to NAICS code nor business patterns data. dBrowse has other operations not reviewed here. See more about dBrowse operations in the CV XE User Guide. With CV XE GIS running click Database on the main menu then select dBrowse. The dBrowse form appears. Note that unless the "read-only" checkbox option is checked during the dBrowse open file dialog, the file will be opened with full read/write ability. If a change is made to any field or record, the change is immediate and permanent. 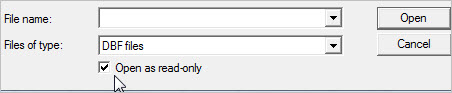 2.1. Using dBrowse with the NAICS Reference Data With the dBrowse form open, use the Open button to open the NAICS/CBP dataset (c:\cvxe\1\naicscbp.dbf). The grid populates with the NAICS codes and descriptions as shown in the following view. 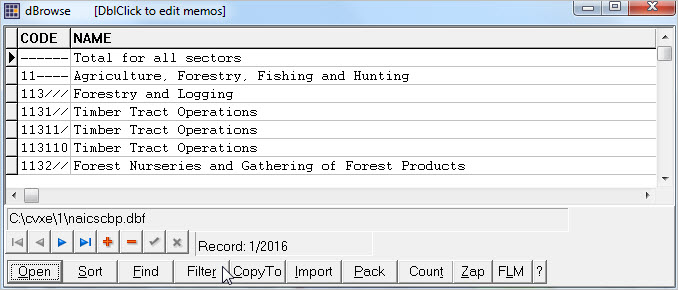 See more about dBrowse operations in the CV XE User Guide. Use this tool as a means to examine NAICS codes or determine the NAICS code based on a partial type of business name. As an example, to view all NAICS categories in the "2-digit" sector 62, click the Filter button below the table, enter the query [substr(code,1,2)='62'] (no brackets) as shown here: 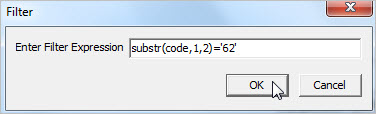 The grid refreshes with only those records in sector 62 as shown below. 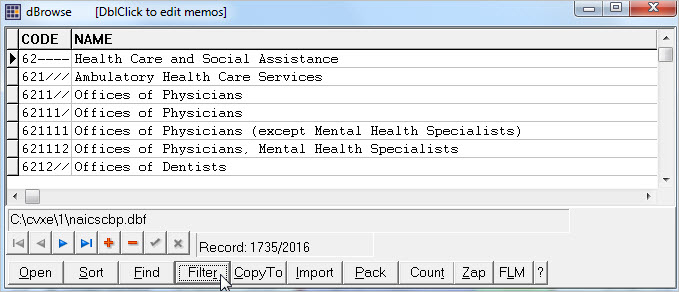 To locate and shown all NAICS codes with the word "Restaurant", the filter [at('Rest',name)>0] (no brackets) can be used. This filter says to locate all records that contain the four characters "Rest" (partial of Restaurant) in the field named "name". Try it yourself and some variations with industries or topics of interest. 2.2. Using dBrowse with the Business Patterns Statistical Data When the dBrowse form open, use the Open button to open the NAICS/CBP dataset (c:\cvxe\1\cbp14.dbf). The grid populates with the CBP data as shown in the following view. 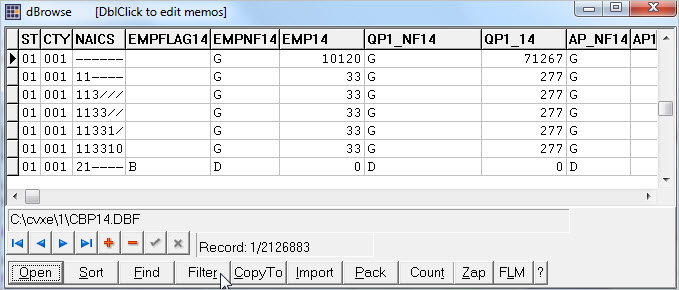 See more about dBrowse operations in the CV XE User Guide. Similar to the NAICS codes data file described above, apply a filter to view only those data records in sector 62: The grid refreshes with only those records in sector 62 as shown below. 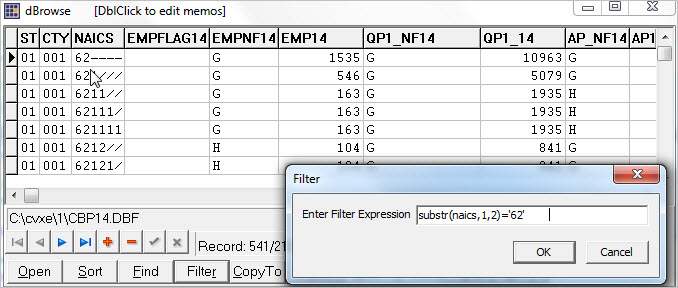 Note that the CBP14 data file does not include the NAICS name/title, but only the code. This is to minimize the size of the file. It is important to use the NAICS file in combination. These files are used together in the BusinessPatterns operations reviewed below. To display columns/fields in this file that might be of special interest, use the FLM (Field Location Manager) button below the table. Use of the FLM button has no impact on the permanent structure of the file in use. The following graphic illustrates how the FLM operation can be used to select only 6 fields: 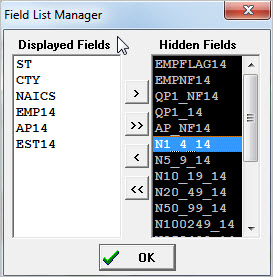 The grid refreshes with only those fields as shown below. 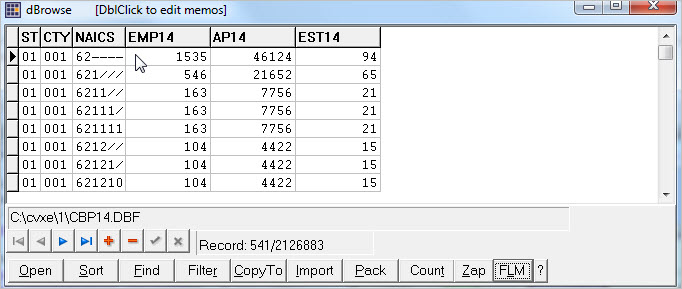 3. Business Patterns Operations The Business Patterns operations make use of the Analytics>BusinessPatterns feature. BusinessPatterns operations reviewed here may be used with any version of CV XE GIS and use tools and data as described and installed in the main business patterns section. With CV XE GIS running click Analytics on the main menu then select BusinessPatterns. The BusinessPatterns form appears. The following view shows the basic BusinessPatterns profile for the 2-digit sectors (click graphic for larger view): 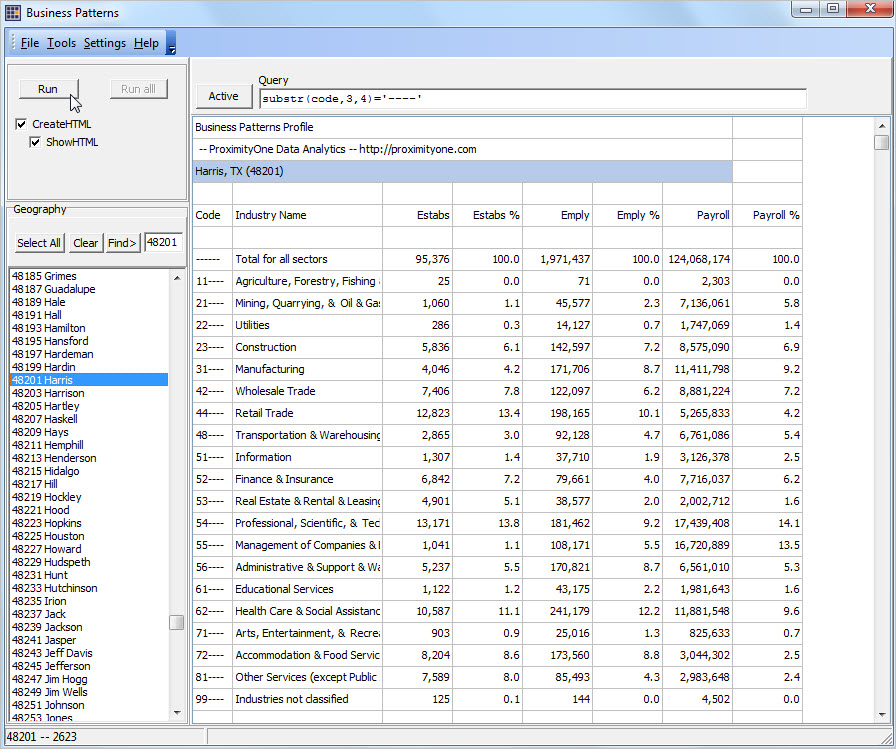 To display the above profile, perform these steps • Click the Find button in geography section in the left control panel. .. this sets the geography selection as Harris County, TX (FIPS code 48201). • Click the Apply button above the grid to apply the filter in the edit box to the CBP database. .. this selects only records meeting the criteria specified in the filter. • Click the Run button at top left of the control panel. .. this starts the process to generate the profile. Setting Queries The query statement substr(code,3,4)='----' .or. substr(code,4,3)='///'filters the database to show only areas having NAICS 2-digit divisional levels or 3-digit NAICS level. This query may be manually entered or set in the Settings/INI form for repeated use of a preferred query. To save the profile in HTML format, for publishing as a Web page or integration in a document, click the SaveHTML check and click Run button again. The HTML file is saved in the data folder (normally c:\cvxe\1. Output Examples (HTML structure) • Los Angeles County, CA -- all NAICS codes • Polk County, IA -- 3-digit NAICS • Cook County, IL -- 3-digit NAICS • Broward County, FL -- 3-digit NAICS • Richland County, SC -- 3-digit NAICS • Harris County, TX -- 3-digit NAICS • Fairfax County, VA -- all 62 NAICS codes .. query: substr(code,1,2)='62' Terms of Use These data are authorized for personal, non-business, use and may not be redistributed nor used to provide professional advice. There is no warranty of any type associated with any aspect of these data. The user is solely responsible to any use, direct or indirect, that might be made of the data. Support Using these Resources Learn more about demographic economic data and related analytical tools. Join us in the Data Analytics Lab sessions. There is no fee for these Web sessions. Each informal session is focused on a specific topic. The open structure also provides for Q&A and discussion of application issues of interest to participants. ProximityOne User Group Join the ProximityOne User Group to keep up-to-date with new developments relating to geographic-demographic-economic decision-making information resources. Receive updates and access to tools and resources available only to members. Use this form to join the User Group. Additional Information ProximityOne develops geographic-demographic-economic data and analytical tools and helps organizations knit together and use diverse data in a decision-making and analytical framework. We develop custom demographic/economic estimates and projections, develop geographic and geocoded address files, and assist with impact and geospatial analyses. Wide-ranging organizations use our software, data and methodologies to analyze their own data integrated with other data. Follow ProximityOne on Twitter at www.twitter.com/proximityone. Contact ProximityOne (888-364-7656) with questions about data covered in this section or to discuss custom estimates, projections or analyses for your areas of interest. |
|
|