
|
|
ProximityOne Main VDAGIS Related Sections - States - Metros - Congressional District - Counties - Cities/Places - Tracts/Neighborhoods - Block Groups - Census Blocks - ZIP Codes - Urban Areas |
Birth and Natality Characterstics and Patterns .. examining births and birth rates by county
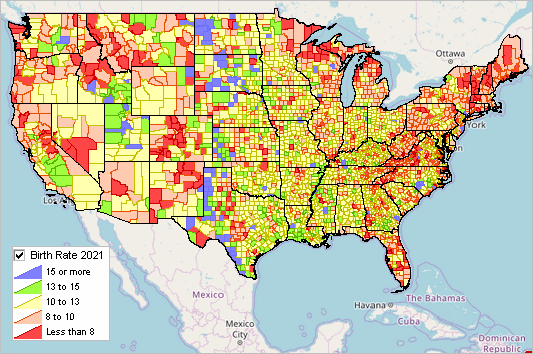
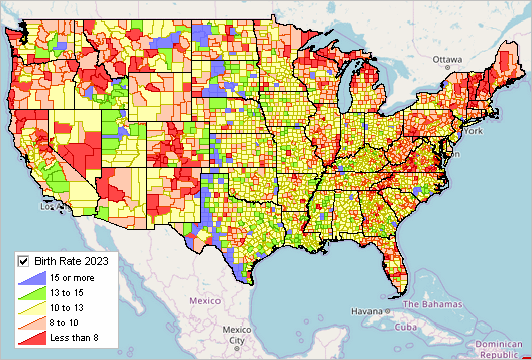
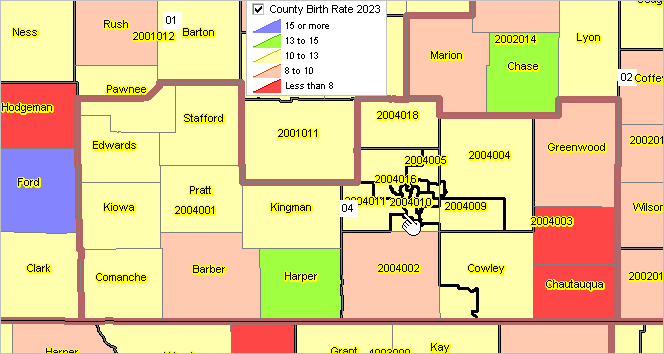
November 2024. During the 2010s, the United States esperienced declining birth rates. Following the decline in the birth rate during and after the pandemic, the number of births increased in some areas and may now be declining again. Based on Census Bureau annual county estimates the total U.S. births were 3,584,459 (2021), 3,679,254 (2022) and 3,653,356 (2023). Examine these county level births and birth rates using this interactive table. Births are a key component in determining how and where population is changing as shown in the population identity: P[a,t] = P[a,t-1} + B[a,t-1,t] - D[a,t-1,t] + M[a,t-1,t], where P[a,t] is the population in area a at time t B[a,t-1,t] is the births in area a during the period t-1 to t D[a,t-1,t] is the deaths in area a during the period t-1 to t M[a,t-1,t] is the net migration in area a during the period t-1 to t These data are of primary interest in understanding population by age trends and year-to-year change. A declining birth rate in more rural areas may signal an increasing dependency ratio resulting in a decreasing tax base among other adverse demographic-economic changes. Summary of U.S. Births & Natality 2022 The most recent births and natality data reported by the National Center for Health Statistics (NCHS) show: • Number of births: 3,667,758 • Birth rate: 11.0 per 1,000 population • Fertility rate: 56.0 births per 1,000 women ages 15-44 • Percent born low birthweight: 8.60% • Percent born preterm: 10.38% • Percent unmarried: 39.8% • Mean age at first birth: 27.4 Births as a Component of Change Estimated Annually by County Graphics presented below show how the birth rate, the number of people born per year per 1,000 population, is distributed by county for 2021 and 2023. These graphics provide insights into how county and regionsl birth rates are changing. These graphics have been developed using the VDAGIS Base Project. The underlying data are based on Census Bureau annually updated population and components of change estimates. Examine these data in more detail using the interactive iVDA tool and the countytrends interactive table. Using interactive iVDA tool to overlay other geography with births and birth rates by county. For example, examine births and birth rates by county with Congressional Community and Congressional District (even by party) overlays. Patterns of Births Rates by County 7/1/20-6/30/21  Patterns of Births Rates by County 7/1/22-6/30/23  Patterns of Births Rates by County, Congressional Community & Kansas Congressional District 04 Kansas Congressional District 04 shown with brown bold boundary. Congressional Communities (CCs) shown labeled with black bold boundary. County birth rate thematic pattern shown by colors/birth rate values in legend. Pointer is in Sedgwick County/Wichita. Note how widely the county birth rate varies among CCs and counties within Kansas Congressional District 04 and adjacent CDs.  These data are of primary interest in understanding population by age trends and year-to-year change. A declining birth rate in more rural areas may signal an increasing dependency ratio resulting in a decreasing tax base among other adverse demographic-economic changes. Note the variation in the county by county birth rates in CD KS-04 .. as with other CDs. Support Using these Resources .. goto top Learn more about accessing and using demographic-economic data and related analytical tools. Join us in a Data Analytics Lab session. There is no fee for these one-hour Web sessions. Each informal session is focused on a specific topic. The open structure also provides for Q&A and discussion of application issues of interest to participants. Additional Information ProximityOne develops geodemographic-economic data and analytical tools and helps organizations knit together and use diverse data in a decision-making and analytical framework. We develop custom demographic/economic estimates and projections, develop geographic and geocoded address files, and assist with impact and geospatial analyses. Wide-ranging organizations use our tools (software, data, methodologies) to analyze their own data integrated with other data. Contact us (888-364-7656) with questions about data covered in this section or to discuss custom estimates, projections or analyses for your areas of interest. |
|
|