
|
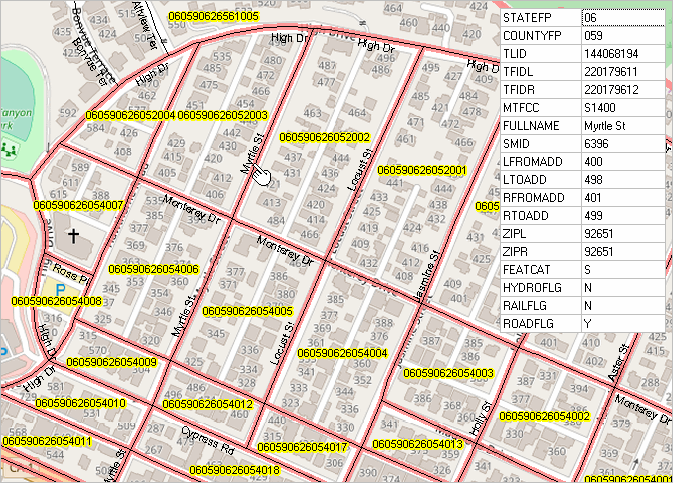
.. Module 2 Geography, Geometry & Shapefiles Contents • Module 1 -- About GIS; GIS Tools and Data Setup/Installation • Module 2 (this module) -- Geography, Geometry & Shapefiles • Module 3 -- Subject Matter: Statistical/Administrative Data • Module 4 -- Integrating Subject Matter with Shapefiles Interpreting & Presenting Data Module 2 -- Geography, Geometry & Shapefiles Learning Objectives • Understand geographic summary levels, geocodes • Understand shapefile structure and use • Ability to access and use pre-existing shapefiles • Ability to address code address data and create related shapefile Recent/New Federal GeoStatistical Data • Census Bureau American Community Survey 2023 1-year estimate (ACS2023) - Detailed demographics for areas 65,000 population and over; release date 9/12/24 see in calendar - Reviewed in Modules 3/4 .. learning about: .. why these data are important .. how to access & use these data - Example of using Census API call to access ACS 2023 1-year poverty data by Congressional District .. https://api.census.gov/data/2023/acs/acs1/profile?get=DP03_0128PE,DP03_0129PE&for=congressional%20district:* .. Two items in file(ACS2023 1 year estimates) plus state and 118th CD codes .. DP03_0128PE Percent of Families and People whose Income in the Past 12 months is below poverty level -- All people .. DP03_0129PE Percent of Families and People whose Income in the Past 12 months is below poverty level -- People under 18 yrs - More in Module 3 • Census Bureau 2024 TIGER Digital Map Database (TIGER2024) - annual update to the Topologically Integrated Geographic Encoding & Reference shapefiles and related data - make this census block level map using iVDA with Base project TIGER 2024 block & roads layers. - the 400 Myrtle St street segment (see pointer) is a bounding street segment for blocks 060590626052003 and 060590626052002 . - click the street segment to show the street segment profile.  Overview & Getting Started Selected GIS Stories using iVDA (below) • Examining demographic characteristics of a metro -- below. • Related drill-down geography -- below. Today, review of selected geography -- summary levels • Core-Based Statisitical Areas (CBSAs --MSAs/MISAs) • Counties • Census tracts • Congressional Communities • K-12 Schools • K-12 School Districts • Geocodes for these summary levels • Using point, line, polygon shapefiles • Accessing Census/TIGER sourced geographic data to show these areas in a map - using the Census Bureau TIGER files .. shapefiles - an example .. accessing TIGER shapefiles - accessing/using a TIGER shapefile 2023 CBSA - mostly geography only; need to integrate subject matter data. Using iVDA .. iVDA part of Visual Data Analytics .. see more about VDAGIS below .. iVDA works on any device; iPhone (not recommended due to screen size) .. start-up view presented below is an interactive mapping window .. watch video .. iVDA is an iframe version of VDA Web GIS4 ..open related VDA Web GIS4 .. sse about using VDA Web GIS4 below .. the page being viewed now is located at https://proximityone.com/gis/1/gis12.htm Metropolitan Statistical Area (MSA) GeoDemographics Click toggle button/line to view instructions. Examine any Metropolitan Statistical Area (zooms to MSA/CBSA)The vintage 2023 935 Core-Based Statistical Areas (CBSAs) in the U.S. (925) and Puerto Rico (10) are comprised of Metropolitan Statistical Areas (MSAs) and Micropolitan Statistical Areas (MISAs). CBSAs are comprised of one or more contiguous counties as defined by OMB. The 935 core-based statistical areas currently defined by the OMB include the 393 MSAs, which have an urban core population of at least 50,000, and the 542 (MISAs), which have an urban core population of at least 10,000 but less than 50,000. See more about CBSAs.Learn to examine MSAs using iVDA with the "Base" project; using the 2023 vintage metropolitan areas. See related interactive table. In the iVDA frame below, proceed as follows: In the Legend Panel at the left of the Map Window, scroll down to "CBSA/MSA 2023 Pop23/SqMi" layer and check on. .. click the + to left of name to expand the interval view The map view refreshes to show a thematic pattern view of the 2023 population by square mile by MSA. Click a MSA of interest in the map .. a demographic profile for that MSA is displayed in the lower left. .. here you can examine a wide range of demographic subject matter items. Examine metro drill-down characteristicsNext, examine a specific metrot; maybe the Dallas metro as an example.In the searchbar, key in "Dallas, TX" and press enter (no quotes, not case sensitive) .. the map refreshes showing a zoom-in to the Dallas, TX area Check on these layers: .. "Counties Bold" .. "County Name" .. "Tracts ACS22 $MHI" The map view now shows patterns of economic prosperity (median household income) by census tract for the Dallas, TX MSA. .. using data from the American Community Survey 2022 (ACS2022) View a demographic-economic profile for any selected tract: .. click on a tract the map (see pointer in example below); the lower left panel profile updates. .. a demographic profile for that tract is displayed in the lower left. .. here you can examine a wide range of demographic subject matter items. The start-up shows the U.S. lower 48 states by county. Supplemental Topics
|
|
|