
|
|
|
2013-14 School Districts -- Geographic Characteristics & Mapping Applications
August 2016 Update. This section has been updated using 2015-16 school district boundaries. See the updated section at http://proximityone.com/sd1516.htm. The master set of U.S. school district boundary files (shapefiles) is updated every two years. The 2013-14 update is now available and includes 13,479 school districts. These shapefiles provide the geography to develop thematic pattern and reference maps and perform geospatial analysis using GIS software. The next U.S. school district boundary files master set will be available in late 2016 for the 2015-16 school year. ProximityOne updates this set of boundary files as changes are made on a state-by-state basis. The average 2013-14 school district geographic size (land area) is 275 square miles. Nineteen of the 25 geographically largest 2013-14 school districts are located in Alaska. The largest district, at almost 89,000 square miles in land area alone, exceeds the size of the State of Minnesota. The geographically smallest school district is Kashia Elementary School District in California and is 0.067 square miles in size. This section will be progressively updated with more information about the 2013-14 vintage school districts. Use the interactive table in this section to view/query/rank/compare districts of interest. Houston ISD, TX Boundary: 2011-12 Compared to 2013-14 The following view illustrates the Houston ISD, TX 2013-14 boundary (red) with the 2011-12 boundary (black). It is easy to see where and how the district has changed (see pointer). Use the school district boundary files with GIS tools to examine how districts of interest have changed. 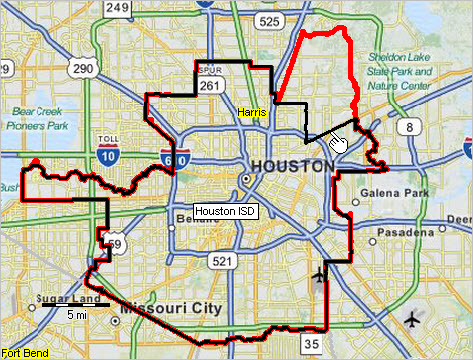
2013-14 School Districts Interactive Table ... rank by column Click column header to sort; click again to sort other direction. See related Ranking Tables Main Page Usage Notes • Click on a column header to sort on that column; click column header again to sort in other direction. • Click ShowAll button to show all areas and restore full set of data view. • Click State to view a selected state (click ShowAll between selections). • Find by Name: key in partial area name in text box to right of Find-in-Name button then click button to locate all matches (case sensitive). • See related ranking tables. ProximityOne User Group Join the ProximityOne User Group to keep up-to-date with new developments relating to children's demographics and school district decision-making information resources. Receive updates and access to tools and resources available only to members. Use this form to join the User Group. There is no fee. Support Using these Resources Learn more about demographic economic data and related analytical tools. Join us in a Decision-Making Information Web session. There is no fee for these one-hour Web sessions. Each informal session is focused on a specific topic. The open structure also provides for Q&A and discussion of application issues of interest to participants. Additional Information ProximityOne develops geographic-demographic-economic data and analytical tools and helps organizations knit together and use diverse data in a decision-making and analytical framework. We develop custom demographic/economic estimates and projections, develop geographic and geocoded address files, and assist with impact and geospatial analyses. Wide-ranging organizations use our tools (software, data, methodologies) to analyze their own data integrated with other data. Follow ProximityOne on Twitter at www.twitter.com/proximityone. Contact ProximityOne (888-364-7656) with questions about data covered in this section or to discuss custom estimates, projections or analyses for your areas of interest. |
|
|