|
|
Decision-Making Information

|
ProximityOne
information resources & solutions
(888) DMI-SOLN
(888) 364-7656
|
American Community Survey (ACS)
-- using the ACS demographic-economic profiles
The American Community Survey (ACS)
demographic-economic profiles are available as organized reports and data files.
They are important and popular because they provide a range of basic demographic-economic data of interest to most users.
While more detailed subject matter are available from the ACS API and summary files, the data meet most user needs or supplement
the more in-depth data. The profile data are available for many types of geographic levels ranging from a national data to the census tract and ZIP code levels.
Demographic profiles (DP) are published in report format individual geographic areas as well as four DP files.
The four DP files are structured as:
• General Demographics .. illustrative Texas state report
• Social Characteristics .. illustrative Texas state report
• Economic Characteristics .. illustrative Texas state report
• Housing Characteristics .. illustrative Texas state report
ProximityOne develops curated versions of the ACS DP files. We use these data to develop more
current estimates and projections.
This section is focused on using the
ACS 2018 1-year U.S. by state demographic-economic profiles.
Similarly structured data for ACS 2019 become available in September 2020 (see more about ACS 2019).
The structure of the DP files is the same for all geographic levels; learning about one type of geography extends to all.
It is also possible to merge the DP data file for different types of geography.
The U.S. by state data used here are available to members of the ProximityOne
User Group.
DP Geographic Availability
Nation
Region
Division
States & U.S. (used in examples below)
County
Tract
Zip Code Tabulation Area (Five-Digit)
School District
Congressional District
State Legislative District (Upper Chamber)
State Legislative District (Lower Chamber)
Public Use Microdata Area
Place
County Subdivision
Alaska Native Regional Corporation
American Indian Area/Alaska Native Area/Hawaiian Home Land
Metropolitan Statistical Area/Micropolitan Statistical Area
Combined Statistical Area
New England City and Town Area
Urban Area
Metropolitan Division
Consolidated City
American Indian Area (Off-Reservation Trust Land Only)/Hawaiian Home Land
American Indian Area/Alaska Native Area (Reservation or Statistical Entity Only)
Combined New England City and Town Area
New England City and Town Division
|
Overview of Broad Subject Matter Topics
DP1
Age and Gender
Race
Hispanic or Latino and Race
Citizenship
DP2
Households by Type
Relationship
Marital Status
Fertility
Grandparents
School Enrollment
Educational Attainment
Veteran Status
Disability Status of the Civilian Noninstitutionalized Population
Mobility -- Residence 1 Year Ago
Place of Birth
U.S. Citizenship Status
Year of Entry
World Region of Birth of Foreign Born
Language Spoken at Home
Ancestry
Computers and Internet Use
DP3
Employment Status
Commuting to Work
Occupation
Industry
Class of Worker
Income and Benefits (In Inflation-Adjusted Dollars)
Health Insurance Coverage
Percentage of Families and People with Income in the Past 12 Months below Poverty Level
DP4
Housing Occupancy
Units In Structure
Year Structure Built
Rooms
Bedrooms
Housing Tenure
Year Householder Moved Into Unit
Vehicles Available
House Heating Fuel
Selected Characteristics
Occupants Per Room
Value
Mortgage Status
Selected Monthly Owner Costs (SMOC)
Selected Monthly Owner Costs as a Percentage of Household Income (SMOCAPI)
Gross Rent
Gross Rent as a Percentage of Household Income (GRAPI)
|
DP File Scope of Subject Matter .. goto top
Social Characteristics Items (DP2)
HOUSEHOLDS BY TYPE
S001 Total households
S002 Family households (families)
S003 With own children of the householder under 18 years
S004 Married-couple family
S005 With own children of the householder under 18 years
S006 Male householder, no wife present, family
S007 With own children of the householder under 18 years
S008 Female householder, no husband present, family
S009 With own children of the householder under 18 years
S010 Nonfamily households
S011 Householder living alone
S012 65 years and over
S013 Households with one or more people under 18 years
S014 Households with one or more people 65 years and over
S015 Average household size
S016 Average family size
RELATIONSHIP
S017 Population in households
S018 Householder
S019 Spouse
S020 Child
S021 Other relatives
S022 Nonrelatives
S023 Unmarried partner
MARITAL STATUS
S024 Males 15 years and over
S025 Never married
S026 Now married, except separated
S027 Separated
S028 Widowed
S029 Divorced
S030 Females 15 years and over
S031 Never married
S032 Now married, except separated
S033 Separated
S034 Widowed
S035 Divorced
FERTILITY
S036 Number of women 15 to 50 years old who had a birth in the past 12 months
S037 Unmarried women (widowed, divorced, and never married)
S038 Per 1,000 unmarried women
S039 Per 1,000 women 15 to 50 years old
S040 Per 1,000 women 15 to 19 years old
S041 Per 1,000 women 20 to 34 years old
S042 Per 1,000 women 35 to 50 years old
GRANDPARENTS
S043 Number of grandparents living with own grandchildren under 18 years
S044 Grandparents responsible for grandchildren
Years responsible for grandchildren
S045 Less than 1 year
S046 1 or 2 years
S047 3 or 4 years
S048 5 or more years
S049 Number of grandparents responsible for own grandchildren under 18 years
S050 Who are female
S051 Who are married
SCHOOL ENROLLMENT
S052 Population 3 years and over enrolled in school
S053 Nursery school, preschool
S054 Kindergarten
S055 Elementary school (grades 1-8)
S056 High school (grades 9-12)
S057 College or graduate school
EDUCATIONAL ATTAINMENT
S058 Population 25 years and over
S059 Less than 9th grade
S060 9th to 12th grade, no diploma
S061 High school graduate (includes equivalency)
S062 Some college, no degree
S063 Associate's degree
S064 Bachelor's degree
S065 Graduate or professional degree
S066 Percent high school graduate or higher
S067 Percent bachelor's degree or higher
VETERAN STATUS
S068 Civilian population 18 years and over
S069 Civilian veterans
DISABILITY STATUS OF THE CIVILIAN NONINSTITUTIONALIZED POPULATION
S070 Total Civilian Noninstitutionalized Population
S071 With a disability
S072 Under 18 years
S073 With a disability
S074 18 to 64 years
S075 With a disability
S076 65 years and over
S077 With a disability
RESIDENCE 1 YEAR AGO
S078 Population 1 year and over
S079 Same house
S080 Different house in the U.S.
S081 Same county
S082 Different county
S083 Same state
S084 Different state
S085 Abroad
PLACE OF BIRTH
S086 Total population
S087 Native
S088 Born in United States
S089 State of residence
S090 Different state
S091 Born in Puerto Rico, U.S. Island areas, or born abroad to American parent(s)
S092 Foreign born
U.S. CITIZENSHIP STATUS
S093 Foreign-born population
S094 Naturalized U.S. citizen
S095 Not a U.S. citizen
YEAR OF ENTRY
S096 Population born outside the United States
S097 Native
S098 Entered 2010 or later
S099 Entered before 2010
S100 Foreign born
S101 Entered 2010 or later
S102 Entered before 2010
WORLD REGION OF BIRTH OF FOREIGN BORN
S103 Foreign-born population, excluding population born at sea
S104 Europe
S105 Asia
S106 Africa
S107 Oceania
S108 Latin America
S109 Northern America
LANGUAGE SPOKEN AT HOME
S110 Population 5 years and over
S111 English only
S112 Language other than English
S113 Speak English less than "very well"
S114 Spanish
S115 Speak English less than "very well"
S116 Other Indo-European languages
S117 Speak English less than "very well"
S118 Asian and Pacific Islander languages
S119 Speak English less than "very well"
S120 Other languages
S121 Speak English less than "very well"
ANCESTRY
S122 Total population
S123 American
S124 Arab
S125 Czech
S126 Danish
S127 Dutch
S128 English
S129 French (except Basque)
S130 French Canadian
S131 German
S132 Greek
S133 Hungarian
S134 Irish
S135 Italian
S136 Lithuanian
S137 Norwegian
S138 Polish
S139 Portuguese
S140 Russian
S141 Scotch-Irish
S142 Scottish
S143 Slovak
S144 Subsaharan African
S145 Swedish
S146 Swiss
S147 Ukrainian
S148 Welsh
S149 West Indian (excluding Hispanic origin groups)
COMPUTERS AND INTERNET USE
S150 Total households
S151 With a computer
S152 With a broadband Internet subscription
|
General Demographics Items (DP5)
AGE AND GENDER
D001 Total population
D002 Male
D003 Female
D004 Gender ratio (males per 100 females)
D005 Under 5 years
D006 5 to 9 years
D007 10 to 14 years
D008 15 to 19 years
D009 20 to 24 years
D010 25 to 34 years
D011 35 to 44 years
D012 45 to 54 years
D013 55 to 59 years
D014 60 to 64 years
D015 65 to 74 years
D016 75 to 84 years
D017 85 years and over
D018 Median age (years)
D019 Under 18 years
D020 16 years and over
D021 18 years and over
D022 21 years and over
D023 62 years and over
D024 65 years and over
D025 18 years and over
D026 Male
D027 Female
D028 18 years and over -- gender ratio (males per 100 females)
D029 65 years and over
D030 Male
D031 Female
D032 65 years and over -- gender ratio (males per 100 females)
RACE
D033 Total population
D034 One race
D035 Two or more races
D036 One race
D037 White
D038 Black or African American
D039 American Indian and Alaska Native
D040 Cherokee tribal grouping
D041 Chippewa tribal grouping
D042 Navajo tribal grouping
D043 Sioux tribal grouping
D044 Asian
D045 Asian Indian
D046 Chinese
D047 Filipino
D048 Japanese
D049 Korean
D050 Vietnamese
D051 Other Asian
D052 Native Hawaiian and Other Pacific Islander
D053 Native Hawaiian
D054 Guamanian or Chamorro
D055 Samoan
D056 Other Pacific Islander
D057 Some other race
D058 Two or more races
D059 White and Black or African American
D060 White and American Indian and Alaska Native
D061 White and Asian
D062 Black or African American and American Indian and Alaska Native
Race alone or in combination with one or more other races
D063 Total population
D064 White
D065 Black or African American
D066 American Indian and Alaska Native
D067 Asian
D068 Native Hawaiian and Other Pacific Islander
D069 Some other race
HISPANIC OR LATINO AND RACE
D070 Total population
D071 Hispanic or Latino (of any race)
D072 Mexican
D073 Puerto Rican
D074 Cuban
D075 Other Hispanic or Latino
D076 Not Hispanic or Latino
D077 White alone
D078 Black or African American alone
D079 American Indian and Alaska Native alone
D080 Asian alone
D081 Native Hawaiian and Other Pacific Islander alone
D082 Some other race alone
D083 Two or more races
D084 Two races including Some other race
D085 Two races excluding Some other race, and Three or more races
D086 Total housing units
CITIZENSHIP
D087 Citizen, 18 and Over Population
D088 Citizen, 18 and Over Population -- Male
D089 Citizen, 18 and Over Population -- Female
|
Housing Characteristics Items (DP4)
HOUSING OCCUPANCY
H001 Total housing units
H002 Occupied housing units
H003 Vacant housing units
H004 Homeowner vacancy rate
H005 Rental vacancy rate
UNITS IN STRUCTURE
H006 Total housing units
H007 1-unit, detached
H008 1-unit, attached
H009 2 units
H010 3 or 4 units
H011 5 to 9 units
H012 10 to 19 units
H013 20 or more units
H014 Mobile home
H015 Boat, RV, van, etc.
YEAR STRUCTURE BUILT
H016 Total housing units
H017 Built 2014 or later
H018 Built 2010 to 2013
H019 Built 2000 to 2009
H020 Built 1990 to 1999
H021 Built 1980 to 1989
H022 Built 1970 to 1979
H023 Built 1960 to 1969
H024 Built 1950 to 1959
H025 Built 1940 to 1949
H026 Built 1939 or earlier
ROOMS
H027 Total housing units
H028 1 room
H029 2 rooms
H030 3 rooms
H031 4 rooms
H032 5 rooms
H033 6 rooms
H034 7 rooms
H035 8 rooms
H036 9 rooms or more
H037 Median rooms
BEDROOMS
H038 Total housing units
H039 No bedroom
H040 1 bedroom
H041 2 bedrooms
H042 3 bedrooms
H043 4 bedrooms
H044 5 or more bedrooms
HOUSING TENURE
H045 Occupied housing units
H046 Owner-occupied
H047 Renter-occupied
H048 Average household size of owner-occupied unit
H049 Average household size of renter-occupied unit
YEAR HOUSEHOLDER MOVED INTO UNIT
H050 Occupied housing units
H051 Moved in 2017 or later
H052 Moved in 2015 to 2016
H053 Moved in 2010 to 2014
H054 Moved in 2000 to 2009
H055 Moved in 1990 to 1999
H056 Moved in 1989 or earlier
VEHICLES AVAILABLE
H057 Occupied housing units
H058 No vehicles available
H059 1 vehicle available
H060 2 vehicles available
H061 3 or more vehicles available
HOUSE HEATING FUEL
H062 Occupied housing units
H063 Utility gas
H064 Bottled, tank, or LP gas
H065 Electricity
H066 Fuel oil, kerosene, etc.
H067 Coal or coke
H068 Wood
H069 Solar energy
H070 Other fuel
H071 No fuel used
SELECTED CHARACTERISTICS
H072 Occupied housing units
H073 Lacking complete plumbing facilities
H074 Lacking complete kitchen facilities
H075 No telephone service available
OCCUPANTS PER ROOM
H076 Occupied housing units
H077 1.00 or less
H078 1.01 to 1.50
H079 1.51 or more
VALUE
H080 Owner-occupied units
H081 Less than $50,000
H082 $50,000 to $99,999
H083 $100,000 to $149,999
H084 $150,000 to $199,999
H085 $200,000 to $299,999
H086 $300,000 to $499,999
H087 $500,000 to $999,999
H088 $1,000,000 or more
H089 Median (dollars)
MORTGAGE STATUS
H090 Owner-occupied units
H091 Housing units with a mortgage
H092 Housing units without a mortgage
SELECTED MONTHLY OWNER COSTS (SMOC)
H093 Housing units with a mortgage
H094 Less than $500
H095 $500 to $999
H096 $1,000 to $1,499
H097 $1,500 to $1,999
H098 $2,000 to $2,499
H099 $2,500 to $2,999
H100 $3,000 or more
H101 Median (dollars)
H102 Housing units without a mortgage
H103 Less than $250
H104 $250 to $399
H105 $400 to $599
H106 $600 to $799
H107 $800 to $999
H108 $1,000 or more
H109 Median (dollars)
SELECTED MONTHLY OWNER COSTS AS A PERCENTAGE OF HOUSEHOLD INCOME (SMOCAPI)
H110 Housing units with a mortgage (excluding units where SMOCAPI cannot be computed)
H111 Less than 20.0 percent
H112 20.0 to 24.9 percent
H113 25.0 to 29.9 percent
H114 30.0 to 34.9 percent
H115 35.0 percent or more
H116 Not computed
H117 Housing unit without a mortgage (excluding units where SMOCAPI cannot be computed)
H118 Less than 10.0 percent
H119 10.0 to 14.9 percent
H120 15.0 to 19.9 percent
H121 20.0 to 24.9 percent
H122 25.0 to 29.9 percent
H123 30.0 to 34.9 percent
H124 35.0 percent or more
H125 Not computed
GROSS RENT
H126 Occupied units paying rent
H127 Less than $500
H128 $500 to $999
H129 $1,000 to $1,499
H130 $1,500 to $1,999
H131 $2,000 to $2,499
H132 $2,500 to $2,999
H133 $3,000 or more
H134 Median (dollars)
H135 No rent paid
GROSS RENT AS A PERCENTAGE OF HOUSEHOLD INCOME (GRAPI)
H136 Occupied units paying rent (excluding units where GRAPI cannot be computed)
H137 Less than 15.0 percent
H138 15.0 to 19.9 percent
H139 20.0 to 24.9 percent
H140 25.0 to 29.9 percent
H141 30.0 to 34.9 percent
H142 35.0 percent or more
H143 Not computed
|
Economic Characteristics Items (DP3)
EMPLOYMENT STATUS
E001 Population 16 years and over
E002 In labor force
E003 Civilian labor force
E004 Employed
E005 Unemployed
E006 Armed Forces
E007 Not in labor force
E008 Civilian labor force
E009 Unemployment Rate
E010 Females 16 years and over
E011 In labor force
E012 Civilian labor force
E013 Employed
E014 Own children of the householder under 6 years
E015 All parents in family in labor force
E016 Own children of the householder 6 to 17 years
E017 All parents in family in labor force
COMMUTING TO WORK
E018 Workers 16 years and over
E019 Car, truck, or van -- drove alone
E020 Car, truck, or van -- carpooled
E021 Public transportation (excluding taxicab)
E022 Walked
E023 Other means
E024 Worked at home
E025 Mean travel time to work (minutes)
OCCUPATION
E026 Civilian employed population 16 years and over
E027 Management, business, science, and arts occupations
E028 Service occupations
E029 Sales and office occupations
E030 Natural resources, construction, and maintenance occupations
E031 Production, transportation, and material moving occupations
INDUSTRY
E032 Civilian employed population 16 years and over
E033 Agriculture, forestry, fishing and hunting, and mining
E034 Construction
E035 Manufacturing
E036 Wholesale trade
E037 Retail trade
E038 Transportation and warehousing, and utilities
E039 Information
E040 Finance and insurance, and real estate and rental and leasing
E041 Professional, scientific, and management, and administrative and waste management services
E042 Educational services, and health care and social assistance
E043 Arts, entertainment, and recreation, and accommodation and food services
E044 Other services, except public administration
E045 Public administration
CLASS OF WORKER
E046 Civilian employed population 16 years and over
E047 Private wage and salary workers
E048 Government workers
E049 Self-employed in own not incorporated business workers
E050 Unpaid family workers
INCOME AND BENEFITS (IN 2015 INFLATION-ADJUSTED DOLLARS)
E051 Total households
E052 Less than $10,000
E053 $10,000 to $14,999
E054 $15,000 to $24,999
E055 $25,000 to $34,999
E056 $35,000 to $49,999
E057 $50,000 to $74,999
E058 $75,000 to $99,999
E059 $100,000 to $149,999
E060 $150,000 to $199,999
E061 $200,000 or more
E062 Median household income (dollars)
E063 Mean household income (dollars)
E064 With earnings
E065 Mean earnings (dollars)
E066 With Social Security
E067 Mean Social Security income (dollars)
E068 With retirement income
E069 Mean retirement income (dollars)
E070 With Supplemental Security Income
E071 Mean Supplemental Security Income (dollars)
E072 With cash public assistance income
E073 Mean cash public assistance income (dollars)
E074 With Food Stamp/SNAP benefits in the past 12 months
E075 Families
E076 Less than $10,000
E077 $10,000 to $14,999
E078 $15,000 to $24,999
E079 $25,000 to $34,999
E080 $35,000 to $49,999
E081 $50,000 to $74,999
E082 $75,000 to $99,999
E083 $100,000 to $149,999
E084 $150,000 to $199,999
E085 $200,000 or more
E086 Median family income (dollars)
E087 Mean family income (dollars)
E088 Per capita income (dollars)
E089 Nonfamily households
E090 Median nonfamily income (dollars)
E091 Mean nonfamily income (dollars)
E092 Median earnings for workers (dollars)
E093 Median earnings for male full-time, year-round workers (dollars)
E094 Median earnings for female full-time, year-round workers (dollars)
HEALTH INSURANCE COVERAGE
E095 .. Civilian Noninstitutionalized Population
E096 .... With health insurance coverage
E097 ...... With private health insurance coverage
E098 ...... With public health coverage
E099 .... No health insurance coverage
E100 .... Civilian Noninstitutionalized Population Under 18 years
E101 ...... No health insurance coverage
E102 .... Civilian noninstitutionalized population 18 to 64 years
E103 ...... In labor force:
E104 ........ Employed:
E105 .......... With health insurance coverage
E106 ............ With private health insurance
E107 ............ With public coverage
E108 .......... No health insurance coverage
E109 ........ Unemployed:
E110 .......... With health insurance coverage
E111 ............ With private health insurance
E112 ............ With public coverage
E113 .......... No health insurance coverage
E114 ...... Not in labor force:
E115 ........ With health insurance coverage
E116 .......... With private health insurance
E117 .......... With public coverage
E118 ........ No health insurance coverage
PERCENTAGE OF FAMILIES AND PEOPLE WHOSE INCOME IN THE PAST 12 MONTHS IS BELOW THE POVERTY LEVEL
E119 All families
E120 With related children of the householder under 18 years
E121 With related children of the householder under 5 years only
E122 Married couple families
E123 With related children of the householder under 18 years
E124 With related children of the householder under 5 years only
E125 Families with female householder, no husband present
E126 With related children of the householder under 18 years
E127 With related children of the householder under 5 years only
E128 All people
E129 Under 18 years
E130 Related children of the householder under 18 years
E131 Related children of the householder under 5 years
E132 Related children of the householder 5 to 17 years
E133 18 years and over
E134 18 to 64 years
E135 65 years and over
E136 People in families
E137 Unrelated individuals 15 years and over
|
DP File Structure .. goto top
Expand the U.S. states ACS 2018 1-year zip file
to a local folder (requires User Group ID;
join here). These files are available:
• ACSDP1Y2018DP05st.xlsx - general demographics
• ACSDP1Y2018DP02st.xlsx - social characteristics
• ACSDP1Y2018DP03st.xlsx - economic characteristics
• ACSDP1Y2018DP04st.xlsx - housing characteristics
• ACSDP5Y2018DP05_metadata.csv
• ACSDP5Y2018DP02_metadata.csv
• ACSDP5Y2018DP03_metadata.csv
• ACSDP5Y2018DP04_metadata.csv
• meta_acsdpitems.xls
Using the DP Files/Data .. goto top
Focus on the structure the general demographic file -- ACSDP1Y2018DP05st.xlsx.
Each file type has some structural similarity.
Opening that file, the view appears as shown here:
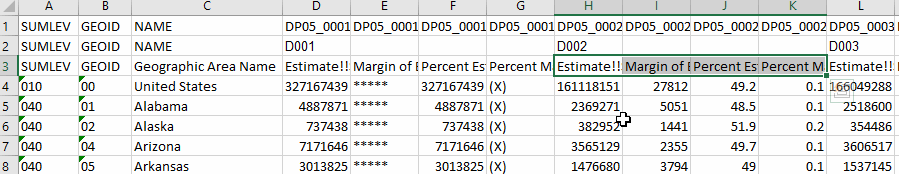
The first three columns are structurally the same across all four file types:
.. SUMLEV -- the code for the geographic summary level (e.g., 010: U.S., 040: state; 860:ZIP Code area)
.. GEOID -- the unique geographic id (geocode) for this area in the U.S.
a 20-character field that will accommodate any statistical/legal area geocode
.. NAME -- the name of the this area.
There are four cells for each subject matter item. For Item D002, the header cells are:
.. Estimate!!SEX AND AGE!!Total population!!Male
.. Margin of Error!!SEX AND AGE!!Total population!!Male
.. Percent Estimate!!SEX AND AGE!!Total population!!Male
.. Percent Margin of Error!!SEX AND AGE!!Total population!!Male
Many users will focus on the first cell, the estimates. In this file, the first actual data record is for the U.S. and the second for Alabama.
See that the estimated number of males in Alabama in 2018 (D002) is 2,369,271. The estimates has a margin of error (MOE) of 5,051.
We leave three header rows to give the user discretion over which rows to keep/use. Possibly all.
Many users will want to use the estimate of the item only (not the MOE, percent, or percent MOE.
To accommodate this, the second header row shows Item codes assigned by ProximityOne.
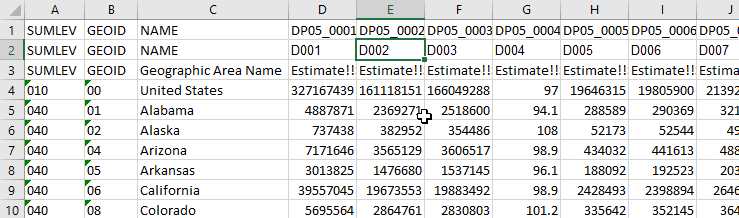
Modifying DP File Structure for Analytic Use .. goto top
To only use the basic estimates columns, a macro can be used.
Step 1: Open the DP file in Excel.
Step 2: Press Alt+F11 to open the VBA Editor
Step 3: Insert a code module from then insert menu.
Step 4: Copy the code below and paste it in the code module inserted in the above step.
Step 5: Press F5 to execute the code.
Observe that the Columns are deleted from worksheet when the cell value is blank in row 2.
Code to insert:
Sub sbDelete_Columns_Based_On_Criteria()
Dim lColumn As Long
Dim iCntr As Long
lColumn = 650
For iCntr = lColumn To 1 Step -1
    If Cells(2, iCntr) = "" Then
        Columns(iCntr).Delete
    End If
Next
End Sub
The file now appears as shown here:
Additional Details .. goto top
For more information on race and Hispanic origin data, see the Census 2010 Brief entitled,
Overview of Race and Hispanic Origin: 2010
, issued March 2011. (pdf format)
Symbols used in reports and data files (values embedded in cells):
- An "**" entry in the margin of error column indicates that either no sample observations or too few sample observations were available to compute a standard error and thus the margin of error. A statistical test is not appropriate.
- An "-" entry in the estimate column indicates that either no sample observations or too few sample observations were available to compute an estimate, or a ratio of medians cannot be calculated because one or both of the median estimates falls in the lowest interval or upper interval of an open-ended distribution, or the margin of error associated with a median was larger than the median itself.
- An "-" following a median estimate means the median falls in the lowest interval of an open-ended distribution.
- An "+" following a median estimate means the median falls in the upper interval of an open-ended distribution.
- An "***" entry in the margin of error column indicates that the median falls in the lowest interval or upper interval of an open-ended distribution. A statistical test is not appropriate.
- An "*****" entry in the margin of error column indicates that the estimate is controlled. A statistical test for sampling variability is not appropriate.
- An "N" entry in the estimate and margin of error columns indicates that data for this geographic area cannot be displayed because the number of sample cases is too small.
- An "(X)" means that the estimate is not applicable or not available.
Learn more about using API tools to access more subject matter for many different types of geography.
Participate in the Using GIS and GeoDemographics Course.
Contact us for information on support services.
Reference .. go top
• ACS 2018 Questionnaire
• Summary File Technical Documentation
• ACS 2018 Tables Shells
• ACS 2018 1-year Sequence Table Lookup
• ACS 2018 1-Year Appendices
ProximityOne User Group ... goto top
Join the ProximityOne User Group
to keep up-to-date with new developments relating to metros and component geography decision-making information resources.
Receive updates and access to tools and resources available only to members.
Use this form to join the User Group.
Support Using these Resources
Learn more about accessing and using demographic-economic data and related analytical tools.
Join us in a Data Analytics Lab session.
There is no fee for these one-hour Web sessions.
Each informal session is focused on a specific topic.
The open structure also provides for Q&A and discussion of application issues of interest to participants.
Additional Information
ProximityOne develops geodemographic-economic data and analytical tools and helps organizations knit together and use diverse data in a decision-making and analytical framework. We develop custom demographic/economic estimates and projections, develop geographic and geocoded address files, and assist with impact and geospatial analyses.
Wide-ranging organizations use our tools (software, data, methodologies) to analyze their own data integrated with other data.
Follow ProximityOne on Twitter at www.twitter.com/proximityone.
Contact us (888-364-7656) with questions about data covered in this section or to discuss
custom estimates, projections or analyses for your areas of interest.
|
