
|
|
|
Geocoding Addresses & Address Shapefiles
There are many online tools that enable you to key in an address and show the location on a map. This section is focused on creating and using address-based point shapefiles in a GIS context. These methods provide similar information, showing the addresses on a map, but also enable a wide range of analytical capabilities. For example, find out how many of your addresses are in one county or census tract. Or, determine the census block or school district for each address. Visualize Address Locations 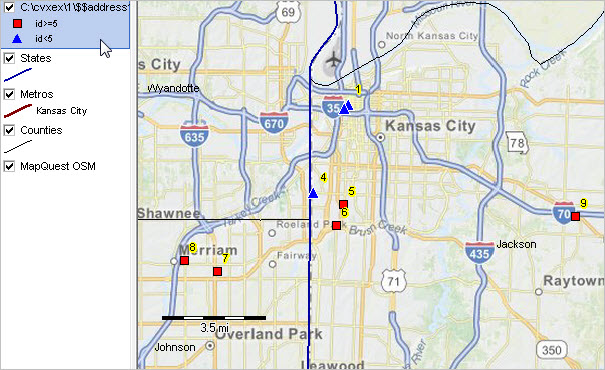
The above views illustrates use of Find Address tool, described below, to locate/show addresses listed below. Marker/locations are shown with different markers based on a query. Markers are labeled with the point ID. 1100 Main St, Kansas City, MO 64105 1301 Wyandotte St, Kansas City, MO 64105 1701 W. 39th Street, Kansas City, MO 64111 4101 Main Street, Kansas City, MO 64111 302 Nichols Rd., Kansas City, MO 64112 6100 Broadmoor St, Mission, KS 66202 5800 Antioch Rd, Merriam, KS 66202 11815 E Highway 40, Independence, MO 64055 Use the no-fee ProximityOne User Group version of the CV XE GIS software to enter addresses, show them on a map and automatically save the shapefile for reuse in the existing or other GIS projects. Entering Addresses Install CV XE GIS software and enter your User Group userid. Start CV XE GIS and select the Tools>Find Address feature. After clicking Tools>Find Address, prompt appears showing default address. Enter an address or use the default value; click OK. Optionally continue adding addresses. End the process by entering null address (no value). The first step is illustrated in the following graphic using an address in the Kansas City, MO area. 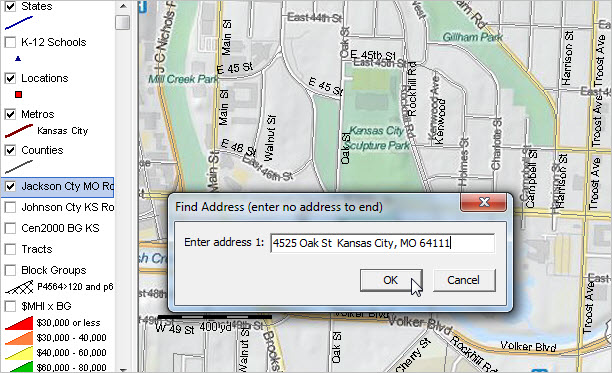
Shapefile Automatically Created The default point shapefile name c:\cvxe\1\$$address1.shp is created as shown in message in the graphic below. In this example, only one address was entered. The address location is shown by the red marker. The shapefile is added to the existing GIS project. See legend panel top left in the graphic. 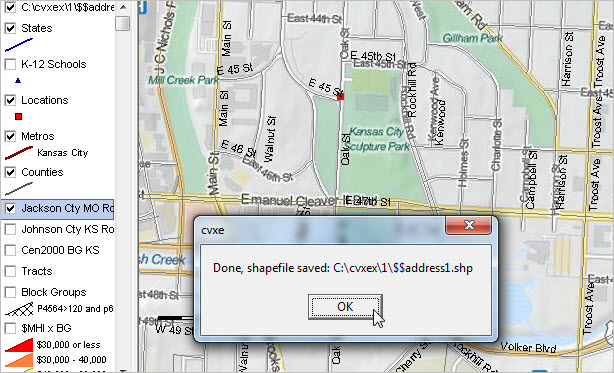
Using the Results The next graphic illustrates using the Identify tool to click on point which displays the mini-profile for the selected point/address. Address/point attributes that are automatically created include the point number and address in 'name' field. Use other features of the software to modify the marker/point appearance, label the addresses or add other attributes to each address. 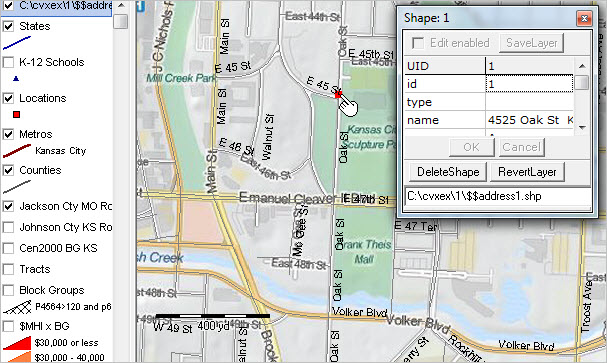
Unlike online address-locators and display services, using the GIS operation you can determine which in which census block or other political/statistical areas (congressional district, school district, etc.) the address is located. If your point shapefile contains many addresses there are also geospatial analysis tools that can be used. Use the site analysis feature select a group of addresses, visually on the map, and create/display a profile of aggregated data for the selection of points. Contextual View of Matched Road/Street Segment You can also view the address locations in context of the matched street segment. The next graphic shows a zoom-in view. The roads/streets layer has made active (click on layer name in legend panel). The Identify tool is used to create mini-profile of matched street segment as shown in the graphic below. By using the road segment attributes, the census block code (and higher level geocodes) can be determined/assigned. See more about the road segment attributes. 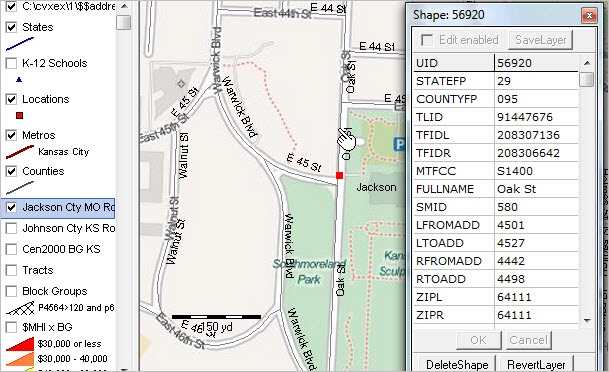
There are many other tools to create address-based point shapefiles. For example, you might have a file with existing latitude-longitude values/fields. In this case, the Find Address or Find Address-Batch operation is not needed -- the latitude-longitude values have already been assigned. Creating a point shapefile by importing records with existing latitude-longitude will be reviewed related section. Support Using these Resources Learn more about demographic economic data and related analytical tools. Join us in a Data Analytics session. There is no fee for these Web sessions. Each informal session is focused on a specific topic. The open structure also provides for Q&A and discussion of application issues of interest to participants. ProximityOne User Group Join the ProximityOne User Group to keep up-to-date with new developments relating to geographic-demographic-economic decision-making information resources. Receive updates and access to tools and resources available only to members. Use this form to join the User Group. There is no fee. Additional Information ProximityOne develops geographic-demographic-economic data and analytical tools and helps organizations knit together and use diverse data in a decision-making and analytical framework. We develop custom demographic/economic estimates and projections, develop geographic and geocoded address files, and assist with impact and geospatial analyses. Wide-ranging organizations use our software, data and methodologies to analyze their own data integrated with other data. Follow ProximityOne on Twitter at www.twitter.com/proximityone. Contact ProximityOne (888-364-7656) with questions about data covered in this section or to discuss custom estimates, projections or analyses for your areas of interest. |
|
|