
|
|
|
-- Crime Incidence and Socioeconomic Patterns -- Analyzing Small-Area and Location-Based Data .. this section examines how Geographic Information System (GIS) tools, combined with crime incidence and socioeconomic data, can be used to facilitate crime management, law enforcement operations and the quality of life. It is important to be able to relate crime incidence to neighborhoods, cities, counties, rural areas, among others on a time series basis .. how, where and what crimes are trending. These patterns and trends can be visualized using mapping and analytical tools to facilitate law enforcement. Crime data analytics can help allocate resources. Stakeholders can better assess how their neighborhoods/communities are being impacted. Policy-makers can better develop programs and operations based on crime data analytics and tools. But, relating crime incidence to neighborhoods and larger areas is challenging for several reasons. Crime incidence data are reported by different types of law enforcement entities using different criteria. In general, it is diffcult to acquire crime incidence data coded by accurate address even when possible. Crime incidence data are reported with various levels of transparency and public accessibility. Public data availability of correctly tabulated crime incidence data by location is the biggest challenge to crime data analytics. What are the crime patterns in neighborhoods or areas of interest? It is challenging to get useful answers to this type of question. Crime incidence data by location/address are often difficult or not possible to obtain. Even where the location-based crime data are available, the data must be geocoded, e.g., assigned a census block code to each address. Separately demographic-economic must be organized to examine contextually with the crime data. Integrating Crimes by Location & Patterns of Economic Prosperity The following graphic shows crime locations as red markers in context of patterns of median household income based on American Community Survey 2020 (ACS 2020) by block group and neighborhood boundaries with roads/streets in the Kansas City, MO area. Click graphic for larger view.  Visual Data Analytics .. examine crime incidence using GIS tools Use the VDA Web GIS with the Crime Data Analytics GIS project to create variations of the above view using only a Web browser, nothing to install. VDA Web GIS is developed and maintained by Warren Glimpse, ProximityOne, Alexandria, VA USA and Takashi Hamilton, Tsukasa, Osaka, Japan. Start VDA Web GIS using most any browser. Alternatively, use the CV XE GIS Windows desktop software with a ready-to-use GIS project. We use CV XE GIS to develop GIS project/filesets then port these for use with VDA Web GIS. Crime Data Analytics Insights Use the Crime Incidence and Socioeconomic Patterns GIS project and associated datasets to explore relationships between crime and small area demographic-economic characteristics. Follow the steps described below in this section to study patterns and relationships in Kansas City and/or use this framework to develop similar data analytics for other areas. Framework for a case study. 409 of Missouri's 4,506 block groups are within the jurisdiction of the Kansas City police department (KCPD) and had one or more crimes. There were approximately 10,400 crimes recorded by the KCPD in the study year, in the city area spanning four counties. In this section tools and data are used to examine crime patterns in Kansas City, MO. Crime data are included as markers/locations in a GIS project. Crime data are also aggregated to the census block level and examined as summary data (aggregate crimes by census block). Crime data are related to American Community Survey (ACS) 2020 5-year demographic-economic data at the block group geographic level. To perform these types of analyses, it is important to start with location-based crime data that have been attributed with type of offense (offense code). Ideally, each crime incidence data record includes minimally the offense code and address of the crime. Such location-based crime incidence data have been acquired from the KCPD. These data are used to develop a shapefile that can be included in a GIS project. Patterns of Crime Incidence in Kansas City, MO The following graphic shows patterns of crime incidence by census block for the "Plaza Area" within Kansas city. This view shows all types of crimes aggregated to the census block level. Crimes committed where a handgun was involved are shown as black/red circular markers. Click the graphic for a larger view that shows legend and more detail.  - View developed using CV XE GIS and related GIS project. Related views (click link to view graphic in new window): Use the GIS project to develop variations of these views. Optionally add your own data. • Lay of the land: Kansas City city (cross hatched) in context of metro • All crimes as markers in Kansas City in 2014 Patterns of Economic Prosperity & Crime Incidence The following graphic shows patterns of economic prosperity (median household income $MHI) by block group for the same general area as above. This view illustrates how two types of crimes (burglary blue triangle markers and homicide (red/black square markers) can be examined in context. Click the graphic for a larger view that shows legend and more detail. 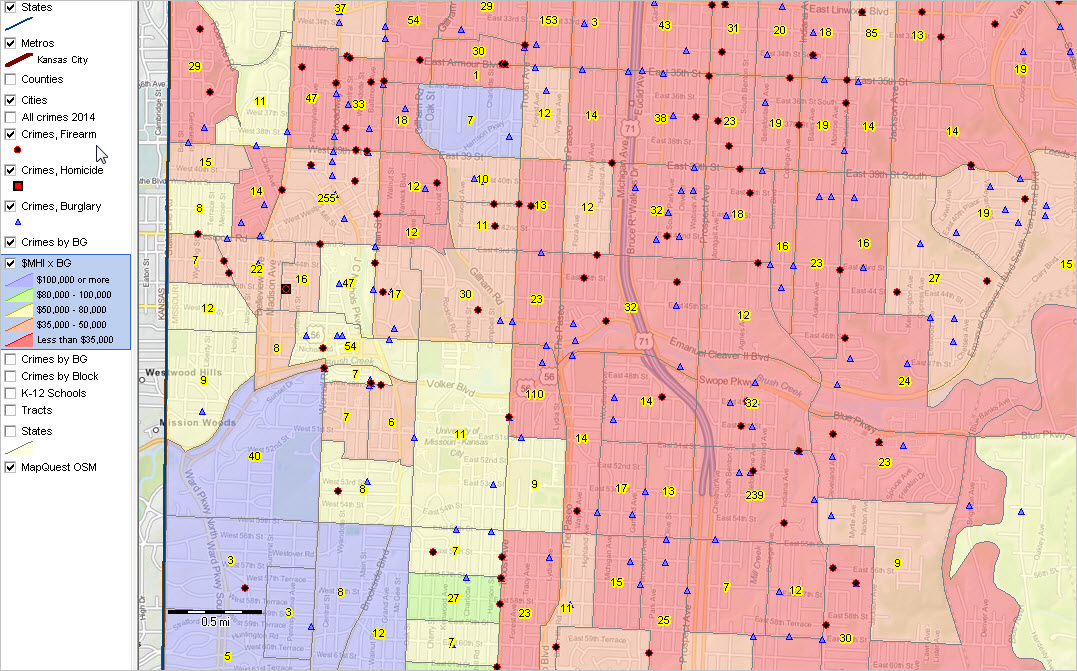 Related views (click link to view graphic in new window): Use the GIS project to develop variations of these views. • View similar to above, without $MHI layer Data used to analyze patterns of economic prosperity/$MHI are based on the American Community Survey (ACS) 2020 5-year estimates at the block group geographic level. The same scope of subject matter is available for higher level geography. The GIS project/datasets includes many types of demographic-economic subject matter that can be used to display/analyze different socioeconomic patterns. Using Block Group Geography/Data Census Block Groups sit in a "mid-range" geography between census blocks and census tracts. All cover the U.S. wall-to-wall and nest together, census blocks being the lowest common denominator for each. Block Groups (BGs) are the smallest geographic area for which annually updated ACS 5-year estimates data are tabulated. Advantages of using BG geodemographics include the maximum degree of geographic drill-down (using ACS data) ... enabling the most micro-perspective of demographics for a neighborhood or part of study area. A disadvantages of using BG estimates is that typically the smaller area estimates have a relatively higher error of estimate. Crime Incidence and Socioeconomic Patterns (CISP) GIS Project/Datasets 1. Install the ProximityOne CV XE GIS ... omit this step if CV XE GIS software already installed. ... run the CV XE GIS installer ... take all defaults during installation 2. Download the CISP GIS Project fileset ... requires ProximityOne User Group ID (join now) ... unzip Crime Analytics GIS project files to local folder c:\crime_analytics 3. Open the crime_analytics.gis project ... after completing the above steps, click File>Open>Dialog ... open the file named C:\crime_analytics\crime_analytics.gis 4. Done .. the start-up view is similar to the graphic shown at the top of this section. Join us in a Data Analytics Web session to review details about installing and using this project. More About Crime Data The most useful crime data are maintained at the local level. The data are most recent, typically include more detail than available elsewhere and sometimes not available from state or national sources. Federal statistical data resources include: • Federal Bureau of Investigation • Bureau of Justice Statistics • Census Bureau Federally-Sponsored Data Programs ProximityOne User Group Join the ProximityOne User Group to keep up-to-date with new developments relating to metros and component geography decision-making information resources. Receive updates and access to tools and resources available only to members. Use this form to join the User Group. Support Using these Resources Learn more about accessing and using demographic-economic data and related analytical tools. Join us in a Data Analytics Lab session. There is no fee for these one-hour Web sessions. Each informal session is focused on a specific topic. The open structure also provides for Q&A and discussion of application issues of interest to participants. Additional Information ProximityOne develops geodemographic-economic data and analytical tools and helps organizations knit together and use diverse data in a decision-making and analytical framework. We develop custom demographic/economic estimates and projections, develop geographic and geocoded address files, and assist with impact and geospatial analyses. Wide-ranging organizations use our tools (software, data, methodologies) to analyze their own data integrated with other data. Follow ProximityOne on Twitter at www.twitter.com/proximityone. Contact us (888-364-7656) with questions about data covered in this section or to discuss custom estimates, projections or analyses for your areas of interest. |
|
|