
|
|
Linguistic Isolation by Block Group
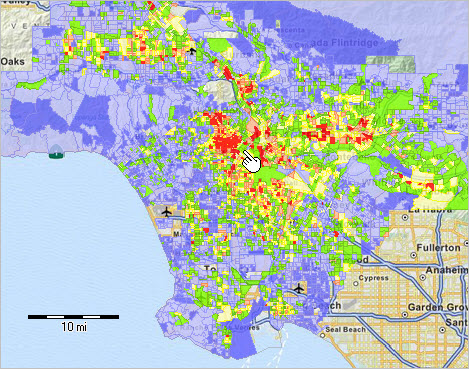
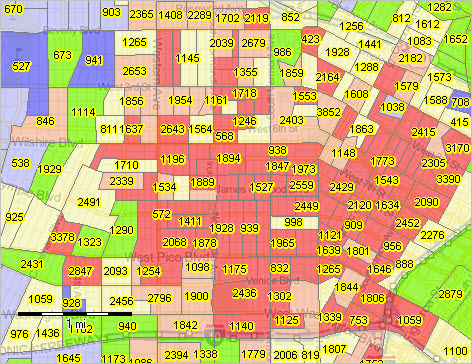
Linguistic isolation inhibits the ability of people and households to integrate into neighborhoods, cities and living areas. Opportunities for advancement and participation in society are improved where linguistic isolation is minimal. This section describes tools and data resources to examine patterns of linguistic isolation for block group level geography. Use the GIS project/datasets described below to visually, geospatially, analyze patterns of linguistic isolation by block group. Develop variations to examine your areas of interest. Size and distribution data on speakers of languages other than English and on their English speaking ability are important for many reasons. These data help us understand where populations with special needs exist and how they are changing. The data are used in a wide-ranging legislative, policy, and research applications. Many legal, financial and marketing decisions involving language-based issues make use of data on language use and English-speaking ability. Data used to analyze patterns of "household linguistic isolation" are based on the American Community Survey (ACS) 2014 5-year estimates at the block group geographic level. The same scope of subject matter is available for higher level geography. The following graphic shows patterns of linguistic isolation in Los Angeles County. Block groups colored in red have more than 40-percent of households where no household member age 14 years and over speaks English "very well". Click graphic for larger view showing more detail and legend. Patterns of Linguistic Isolation; Los Angeles County, CA  - View developed using CV XE GIS and related GIS project. The next view shows a zoom-in to the vicinity of the pointer shown in the above map. This view shows block groups labeled with total population. Click graphic for larger view showing more detail and legend.  - View developed using CV XE GIS and related GIS project. Language Spoken by Households - Tabular View The table presented below shows data from ACS Table B16002 Households by Linguistic Isolation for block group 1 in census tract 212304 (also referred to as 2123.04) in Los Angeles County (037) California (06); geoid=060372123041. This block group is shown toward the center of the above view with population 1,894. Data for this block group are shown in the rightmost column of the table below. 47.2 percent of households (803) are linguistically isolated (317+0+62).
-- "Language Spoken" categories are based on four major language groups. More About Linguistic Isolation One definition of a "linguistically isolated household" is a household in which all adults have substantial limitation in communicating English. In the ACS data, a household is classified as "linguistically isolated" if 1) no household member age 14 years and over spoke only English, and 2) no household member age 14 years and over who spoke another language spoke English "very well". Like many demographic measures, linguistic isolation tends to be "masked" when analyzing data for larger geographic areas, even census tracts, are used. Block group geography provides an ability to locate linguistic isolation in sub-neighborhood areas. Using Block Group Geography/Data Census Block Groups sit in a "mid-range" geography between census blocks and census tracts. All cover the U.S. wall-to-wall and nest together, census blocks being the lowest common denominator for each. Block Groups (BGs) are the smallest geographic area for which annually updated ACS 5-year estimates data are tabulated. Advantages of using BG geodemographics include the maximum degree of geographic drill-down (using ACS data) ... enabling the most micro-perspective of demographics for a neighborhood or part of study area. A disadvantages of using BG estimates is that typically the smaller area estimates have a relatively higher error of estimate. Summary of Steps to Access and Use these Data The ACS 2014 5-year Table B16002 data can be accessed for Los Angeles County using the following API call (paste the following text into a browser and press Enter). See more about using Census API operations.
http://api.census.gov/data/2014/acs5?get=NAME,B01001_001E,B16002_001E,B16002_002E,B16002_003E,B16002_004E,B16002_005E,B16002_006E,B16002_007E,B16002_008E,B16002_009E,B16002_010E,B16002_011E,B16002_012E,B16002_013E,B16002_014E&for=block+group:*&in=state:06+county:037
At the end of this string is the text "state:06+county:037". Change the state and county to "state:36+county:061" to access the data for New York County, NY (Manhattan); and similarly for any any county. The results of the API call are shown in this text file. These data are easily imported into an Excel file. The DBF version of the data were integrated into the Los Angeles County 2014 block group shapefile using the CV XE GIS software dBMerge feature. The Layer Editor was then used to develop the map legend/color intervals. Join us in a Data Analytics Lab session to learn more about these steps/operations. Linguistic Isolation GIS Project/Datasets .. the above "Summary of Steps to Access and Use these Data" steps/description are not required to use the GIS resources. 1. Install the ProximityOne CV XE GIS ... omit this step if CV XE GIS software already installed. ... run the CV XE GIS installer ... take all defaults during installation 2. Download the Linguistic Isolation GIS Project fileset ... requires ProximityOne User Group ID (join now) ... unzip Linguistic Isolation GIS project files to local folder Linguistic Isolation GIS Project 3. Open the linguistic_isolation_2014_06037.gis project ... after completing the above steps, click File>Open>Dialog ... open the file named C:\linguistic_isolation\linguistic_isolation_2014_06037.gis 4. Done .. the start-up view is similar to the graphic shown at the top of this section. ProximityOne User Group Join the ProximityOne User Group to keep up-to-date with new developments relating to metros and component geography decision-making information resources. Receive updates and access to tools and resources available only to members. Use this form to join the User Group. Support Using these Resources Learn more about accessing and using demographic-economic data and related analytical tools. Join us in a Data Analytics Lab session. There is no fee for these one-hour Web sessions. Each informal session is focused on a specific topic. The open structure also provides for Q&A and discussion of application issues of interest to participants. Additional Information ProximityOne develops geodemographic-economic data and analytical tools and helps organizations knit together and use diverse data in a decision-making and analytical framework. We develop custom demographic/economic estimates and projections, develop geographic and geocoded address files, and assist with impact and geospatial analyses. Wide-ranging organizations use our tools (software, data, methodologies) to analyze their own data integrated with other data. Follow ProximityOne on Twitter at www.twitter.com/proximityone. Contact us (888-364-7656) with questions about data covered in this section or to discuss custom estimates, projections or analyses for your areas of interest. | |||||||||||||||||||||||||||||||||||||||||||||||||||||
|
|