|
|
|
Examining Linguistic Isolation by Block Group -- applications using Hawaii Block Group Demographics
Size and distribution data on speakers of languages other than English and on their English speaking ability are important for many reasons. These data help us understand where populations with special needs exist and how they are changing. The data are used in a wide-ranging legislative, policy, and research applications. Many legal, financial and marketing decisions involving language-based issues make use of data on language use and English-speaking ability. More about languages spoken. This section provides access to "household linguistic isolation" data from the 2010 American Community Survey (ACS) 5-year estimates for all block groups in Hawaii. The same scope of subject matter is available for national scope block groups and higher level geography. Use the interactive ranking table on this page to examine Hawaii counties, census tracts and block groups of interest. One definition of a "linguistically isolated household" is a household in which all adults have substantial limitation in communicating English. In the ACS data, a household is classified as "linguistically isolated" if 1) no household member age 14 years and over spoke only English, and 2) no household member age 14 years and over who spoke another language spoke English "very well". Like many demographic measures, linguistic isolation tends to be "masked" when analyzing data for larger geographic areas, even census tracts, are used. Block group geography provides an ability to locate linguistic isolation in sub-neighborhood areas. Census Block Groups sit in a "mid-range" geography between census blocks and census tracts. All cover the U.S. wall-to-wall and nest together, census blocks being the lowest common denominator for each. Block Groups (BGs) are the smallest geographic area for which annually updated American Community Survey (BG) data are tabulated. Advantages of using BG geodemographics include the maximum degree of geographic drill-down (using ACS data) ... enabling the most micro-perspective of demographics for a neighborhood or part of study area. A disadvantages of using BG estimates is that typically the smaller area estimates have a relatively higher error of estimate. But that is true only of the ACS data, and not the Census 2010 data which are not estimates and have no error of estimation (though other types of errors may exist). Language Spoken by Households The table presented below shows data from ACS 2010 5-year estimates Table B16002 for Hawaii County Block Group 1 in census tract 020100 (geoid=150010201001 -- see in interactive ranking table). These data are shown in the interactive ranking table for all Hawaii block groups. "Language Spoken" categories are based on four major language groups.
Hawaii Language Spoken by Households by Census 2010 Block Group -- interactive ranking table - click column header to sort; click again to sort other direction. - click ShowAll button between queries. - see other demographic-economic ranking tables Use the above table to view/query/rank/compare household linguistic isolation by Census 2010 block group based on ACS 2010 5-year estimates. The data in the ranking table were developed using the ACS 2010 5-Year Estimates Tracts and Block Groups Summary File. . Visual Analysis of Linguistic Isolation by Block Group The following view was developed using the CV XE GIS software. The map shows a section of Honolulu County where linguistic isolation is most prelavent. See color/fill pattern assignment by linguistic isolation percent of households in the legend at left. Areas with red fill pattern have the highest percent households with linguistic isolation. The identify tool is used to display a mini-profile for a selected block group (see pointer). 328 households of the total 1,062 households (30.9 percent) in this block group are linguistically isolated. All 328 households speak "Asian and Pacific Island languages." 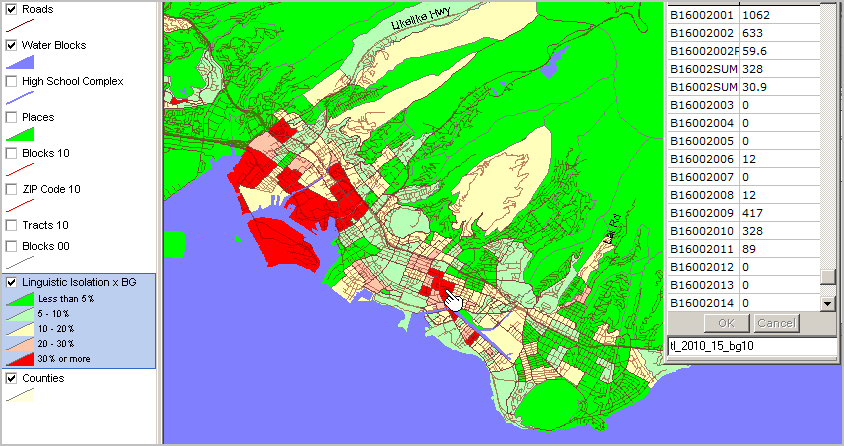
Four Major Language Groups -- as used in Census Bureau statistical programs English Spanish includes Spanish, Spanish Creole, and Ladino. Other Indo-European languages include most languages of Europe and the Indic languages of India. These include the Germanic languages, such as German, Yiddish, and Dutch; the Scandinavian languages, such as Swedish and Norwegian; the Romance languages, such as French, Italian, and Portuguese; the Slavic languages, such as Russian, Polish, and Serbo-Croatian; the Indic languages, such as Hindi, Gujarati, Punjabi, and Urdu; Celtic languages; Greek; Baltic languages; and Iranian languages. Asian and Pacific Island languages include Chinese; Korean; Japanese; Vietnamese; Hmong; Khmer; Lao; Thai; Tagalog or Pilipino; the Dravidian languages of India, such as Telugu, Tamil, and Malayalam; and other languages of Asia and the Pacific, including the Philippine, Polynesian, and Micronesian languages. All Other languages include Uralic languages, such as Hungarian; the Semitic languages, such as Arabic and Hebrew; languages of Africa; native North American languages, including the American Indian and Alaska native languages; and indigenous languages of Central and South America. Languages Spoken at Home: 1980, 1990, 2000 in the U.S.
Additional Information ProximityOne develops geographic-demographic-economic data and analytical tools and helps organizations knit together and use diverse data in a decision-making and analytical framework. We develop custom demographic/economic estimates and projections, develop geographic and geocoded address files, and assist with impact and geospatial analyses. Wide-ranging organizations use our tools (software, data, methodologies) to analyze their own data integrated with other data. Follow ProximityOne on Twitter at www.twitter.com/proximityone. Contact ProximityOne (888-364-7656) with questions about data covered in this section or to discuss custom estimates, projections or analyses for your areas of interest. | |||||||||||||||||||||||||||||||||||||||||||||||||||||||||||||||||||||||||||||||||||||||||||||||||||||||||||||||||||||||||||||||||||||||||||||
|
|