
|
|
|
-- Mapping & Geographic Information System Resources This section has been updated. See Hawaii 2014 GIS. This section provides access to mapping and geographic information system (GIS) resources to facilitate demographic analysis using Hawaii data and geography described in related sections (demographic profiles and high school complex areas). Using a desktop GIS is the only practical way to flexibly examine multiple types of political and statistical area geographies ... changing zoom levels, changing layer positions, changing line styles, changing label styles, etc. The CV XE GIS HI2012 project and fileset has been developed to provide this capability. The project fileset includes all of the relevant layers to view/examine Hawaii high school complexes, cities/places, counties, census tracts, census block groups, census blocks and ZIP code areas. The project includes intersection-to-intersection road/street detail. Install the CV GIS software and HI2012 project fileset on your computer. HI2012 GIS Project Start-up View High School Complex areas shown with blue boundaries; Honolulu County 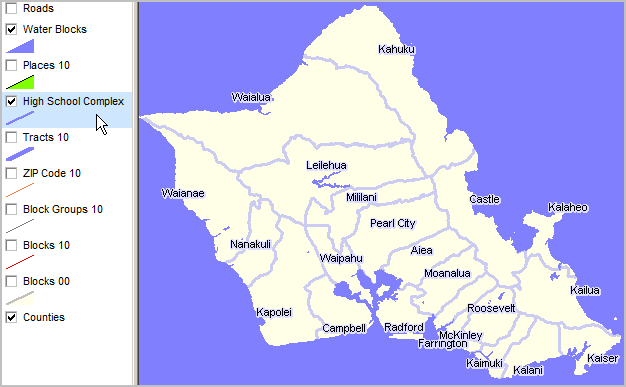
Layers Included in the HI2012 GIS Project Layers shown in the legend panel (left section) in the above view correspond to shapefiles provided in the HI2012 GIS Project fileset. These are all Hawaii statewide shapefiles. Roads Zoom-in view SW Oahu with Roads layer checkbox checked in legend panel. HSC boundaries changed to red to highlight. Zoom to Diamond Head area. Identify tool used to click on a road segment (see pointer). Profile of that road segment shown. 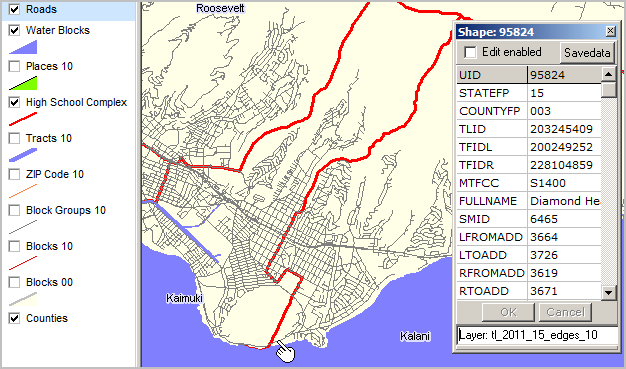
Places Zoom-in view Keaau HSC/Hilo area/Hawaii County with Roads layer checkbox checked in legend panel. HSC boundaries changed to red to highlight. Cities/Places shown with green fill pattern. 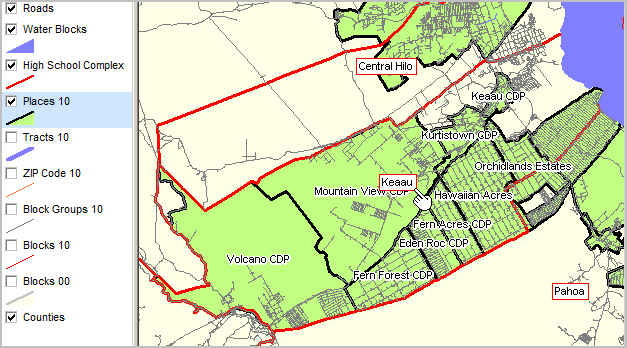
Block Groups Patterns of Median Family Income ($MFI); Oahu by Block Group Identify tool (see pointer) used to show mini-profile for a selected block group (150030004022). Data item B19113001 ($MFI) extracted from ACS 2010 5-year estimates tracts and block groups summary file. See related block group demographic discussion and ranking table. 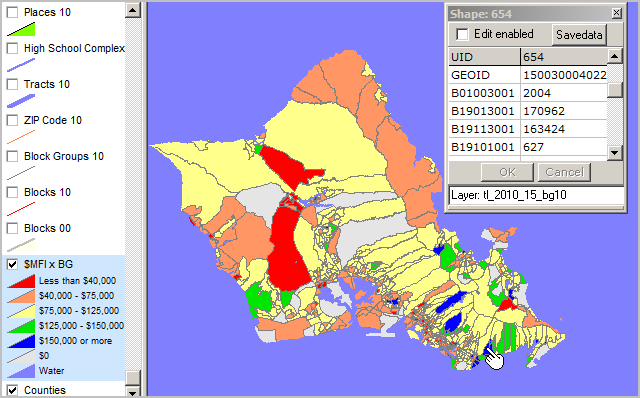
Census 2010 Census Blocks Census 2010 census tracts (blue boundary and label), census blocks (red boundary and label) and streets in Oahu ... Ala Wai Canal shown with blue water blocks. Identify tool (see pointer) used to show mini-profile for a selected block (15-003-001904-2000). Data item P0130001 (total population) extracted from Census 2010 Summary File 1 shows value 1515. The Census 2010 total population of census block 2000 in Oahu tract 19.04 was 1,515. 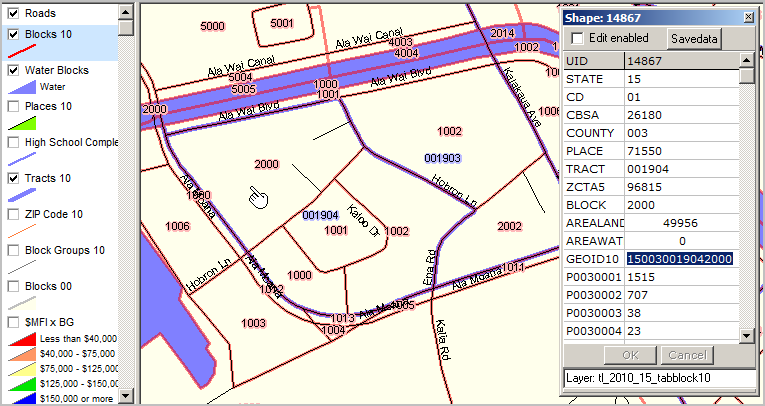
Support Using these Resources Learn more about demographic economic data and related analytical tools. Join us in a Decision-Making Information Web session. There is no fee for these one-hour Web sessions. Each informal session is focused on a specific topic. The open structure also provides for Q&A and discussion of application issues of interest to participants. ProximityOne User Group Join the ProximityOne User Group to keep up-to-date with new developments relating to geographic-demographic-economic decision-making information resources. Receive updates and access to tools and resources available only to members. Use this form to join the User Group. There is no fee. Additional Information ProximityOne develops geographic-demographic-economic data and analytical tools and helps organizations knit together and use diverse data in a decision-making and analytical framework. We develop custom demographic/economic estimates and projections, develop geographic and geocoded address files, and assist with impact and geospatial analyses. Wide-ranging organizations use our tools (software, data, methodologies) to analyze their own data integrated with other data. Follow ProximityOne on Twitter at www.twitter.com/proximityone. Contact ProximityOne (888-364-7656) with questions about data covered in this section or to discuss custom estimates, projections or analyses for your areas of interest. |
|
|