
|
|
|
Using Site Analysis Tools ... applications using the Hawaii 2014 GIS Project
.. tools that you can use for visually-based demographic-economic analysis. • How many of your existing/prospect client locations are in a custom defined geographic area ... like 10 miles from a store location? • How many students are enrolled in free/reduced fee lunch programs in a selection of schools in a neighborhood/area? • What is the population of a certain age in a set of custom selected block groups in a study area? • What is the size of the Asian population in a group of selected counties? These are questions that are easily answered using GIS site analysis tools that can be challenging when using tabular data files and spreadsheets. Often the selection of the geographies (schools, block groups, counties) is more easily performed with visual GIS tools rather than codes in a list. This section provides an overview of using the CV XE GIS Site Analysis operations with the Hawaii 2014 GIS project (see main section). The Site Analysis operations enable you to visually select multiple geographic objects (points, lines, area) that comprise a study area (e.g., a selection of 5 census tracts, a selection of 10 schools, etc.). Use the Site Analysis operations to: • select more or different objects, • output data records associated with selected objects, • aggregate demographic-economic characteristics for those selected objects, • output/save the aggregated data for the collection of selected objects. These operations are not specific to the Hawaii 2014 GIS project (independent of any specific GIS project) but are illustrated here in context of that project. To use this CV XE GIS feature, you must code your User Group ID (case sensitive) in the "Key" edit box shown in the Settings>Start-Up form. This is a one-time change that enables operation of this feature. Starting Site Analysis With CV XE GIS running, click Analytics>SiteAnalyst. The Hawaii2014 GIS project opens. The no fee version of Site Analysis operates only with the Hawaii2014 GIS project. Schools Application The following steps illustrate use of Site Analysis with the public schools layer. • click the name of the K12 public schools layer in the legend panel at left of map. ... it turns blue and is the "active" layer. • the Site Analysis panels appear at right of map. Dbl-click "SCHID'. • scroll down in the upper right section and select FRELCH, REDLCH, TOTFRL (illustrated in graphic below). • in the map window, click on location shown at pointer and drag mouse to one mile radius and release. • schools intersecting with the circle are selected; their summary characteristics are shown in the lower right grid. • there are 8 cross-hatched (in map) schools selected, the total free and reduced lunch enrollment is 2,094 students. • more details about the operations are covered in Web sessions. 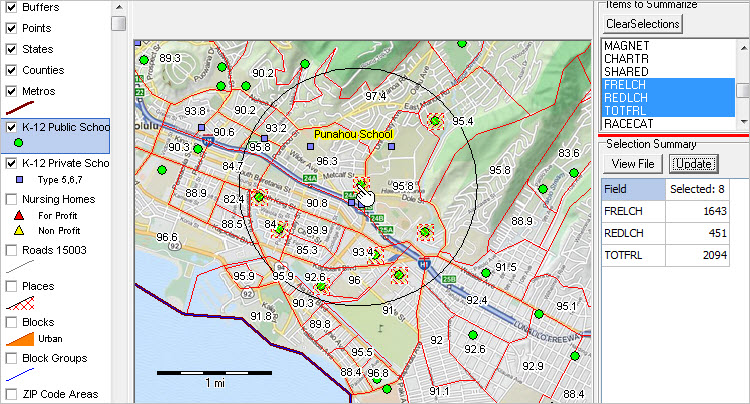 Click graphic for larger view. Census Tracts Application The following steps illustrate use of Site Analysis with a census tracts layer. • click the name of the Tracts %HS Graduate layer in the legend panel at left of map. ... it turns blue and is the "active" layer. • the Site Analysis panels appear at right of map. Dbl-click "GEOID'. • scroll down in the upper right section and select D028 (total population) and D039 (Asian population). ... illustrated in graphic below. ... item names and descriptions shown here. • in the map window, click on location shown at pointer and drag mouse to intersect with two tracts and release. • tracts intersecting with the circle are selected; their summary characteristics are shown in the lower right grid. • there are 2 cross-hatched (in map) tracts selected, the total Asian population is 4,523. • more details about the operations are covered in Web sessions. 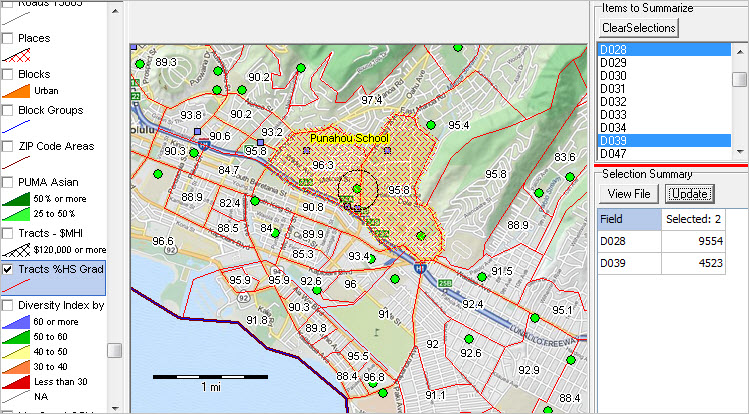 Click graphic for larger view. County Application -- in California The following steps illustrate use of Site Analysis with a county layer. • click the name of the Counties layer in the legend panel at left of map. ... it turns blue and is the "active" layer. • the Site Analysis panels appear at right of map. Dbl-click "GEOID'. • scroll down in the upper right section and select items illustrated in graphic below. ... item names and descriptions shown here. • in the map window, click on location shown at pointer and drag mouse to intersect with two counties and release. • counties intersecting with the circle are selected; their summary characteristics are shown in the lower right grid. • there are 2 cross-hatched (in map) counties selected, the total Census 2010 population was 12,828,837. • more details about the operations are covered in Web sessions. 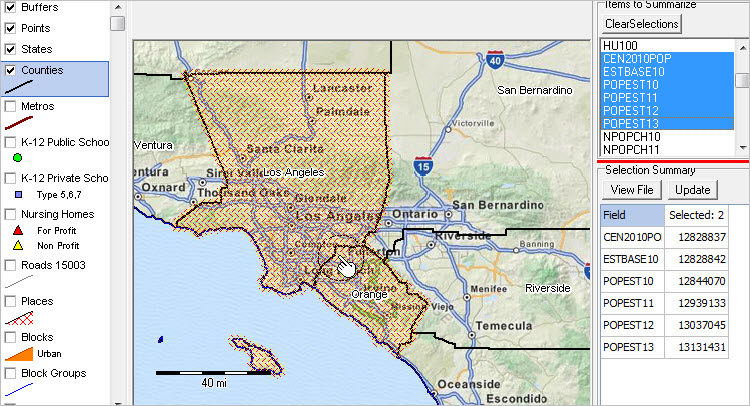 Click graphic for larger view. Summary Data to Clipboard When the lower right grid summary updates, the grid values are written to clipboard. The content of clipboard can optionally be pasted in spreadsheet software. An augmented view of the clipboard data for the above application is shown below.
View/Export Selected Records for Selected Geographies Click View File button to view the selected records (contained in the active shapefile dBASE file). The following view shows the selected records in the county application. Note that only the two records are selected. These records could optionally be exported/saved using the CopyTo button. This view illustrates use of the "Field Location Manager" (FLM) button in tool bar. Use of FLM does not affect structure of the dBASE file. Keying into a field value immediately and permanently modifies the record. 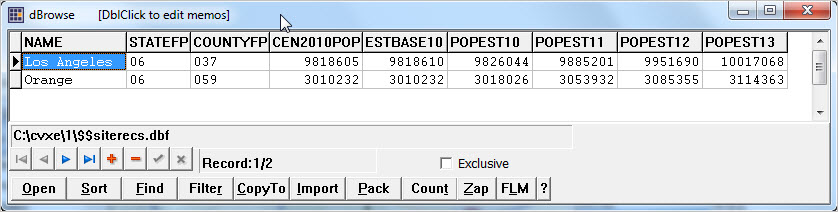 Click graphic for larger view. More Information About Site Analysis Only selected features of Site Analysis have been shown here. See more information at Site Analysis operations. Support Using these Resources Learn more about demographic economic data and related analytical tools. Join us in a Decision-Making Information Web session. There is no fee for these one-hour Web sessions. Each informal session is focused on a specific topic. The open structure also provides for Q&A and discussion of application issues of interest to participants. ProximityOne User Group Join the ProximityOne User Group to keep up-to-date with new developments relating to geographic-demographic-economic decision-making information resources. Receive updates and access to tools and resources available only to members. Use this form to join the User Group. There is no fee. Terms of Use Resources described is this section may be accessed and used only by ProximityOne User Group members. There is no warranty of any type with regard to any aspect of these resources. Users are solely responsible for any use made. ProximityOne User Group resources are exclusively for use by registered members. The resources made not be redistributed. Usage rights are only with registered members and do not extend to any possible associated organization (e.g., a business, university, government agency). We request that reference be made to ProximityOne for usage made of the resources. A suggested reference would be like "Source: ProximityOne; http://proximityone.com" Additional Information ProximityOne develops geographic-demographic-economic data and analytical tools and helps organizations knit together and use diverse data in a decision-making and analytical framework. We develop custom demographic/economic estimates and projections, develop geographic and geocoded address files, and assist with impact and geospatial analyses. Wide-ranging organizations use our tools (software, data, methodologies) to analyze their own data integrated with other data. Follow ProximityOne on Twitter at www.twitter.com/proximityone. Contact ProximityOne (888-364-7656) with questions about data covered in this section or to discuss custom estimates, projections or analyses for your areas of interest. |
|
|