
|
|
|
Creating Demographic-Economic Profiles & Reports -- application illustrations using the Hawaii2014 GIS Project
This section provides an overview of using CV XE GIS to create structured data presentation profiles and reports. Use the CV XE GIS APIGateway API-based features to create demographic-economic profiles. These operations are illustrated using the Hawaii 2014 GIS project but are not specific to that project. U.S. national scope geography is supported (independent of what GIS project is open). Integrated Profile With CV XE GIS running, click File>APIGateway. Click the Run button. The "integrated profile" view is displayed as shown in graphic below. The integrated profile contains data from multi-sourced, multi-statistical program resources. See more about the integrated profile. Operations reviewed in Web session. 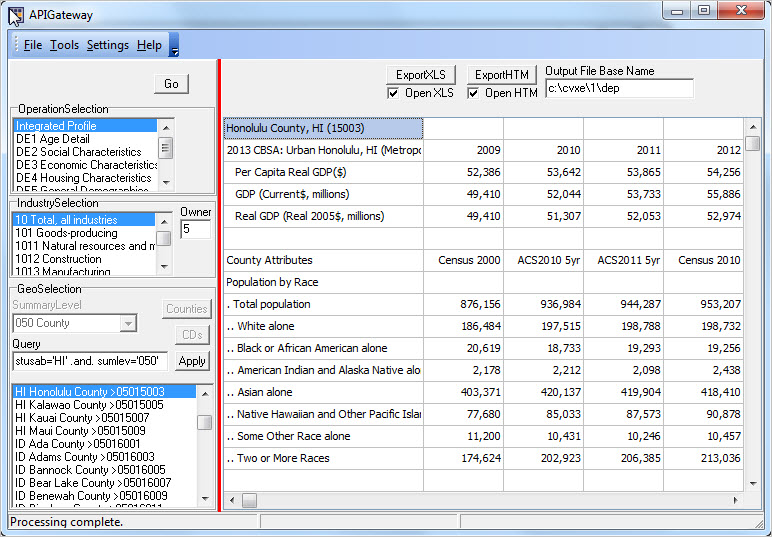 Click graphic for larger view. Demographic-Economic Profiles Use the APIGateway to generate DE2-DE5 Demographic-Economic profiles. • With CV XE GIS running, click File>APIGateway. • Click the "DE2 Social CHaracteristics" in the left panel "OperationSelection." • Scroll to select Honolulu County in the left panel "GeoSelection." • Dbl-click Honolulu County. The DE2 profile view is displayed as shown in graphic below. See more about the DE2 profile. Select any DE2 .. DE3 .. DE4 .. DE5 profile for any county. Operations reviewed in Web session.  Click graphic for larger view. Support Using these Resources Learn more about demographic economic data and related analytical tools. Join us in a Decision-Making Information Web session. There is no fee for these one-hour Web sessions. Each informal session is focused on a specific topic. The open structure also provides for Q&A and discussion of application issues of interest to participants. ProximityOne User Group Join the ProximityOne User Group to keep up-to-date with new developments relating to geographic-demographic-economic decision-making information resources. Receive updates and access to tools and resources available only to members. Use this form to join the User Group. There is no fee. Terms of Use Resources described is this section may be accessed and used only by ProximityOne User Group members. There is no warranty of any type with regard to any aspect of these resources. Users are solely responsible for any use made. ProximityOne User Group resources are exclusively for use by registered members. The resources made not be redistributed. Usage rights are only with registered members and do not extend to any possible associated organization (e.g., a business, university, government agency). We request that reference be made to ProximityOne for usage made of the resources. A suggested reference would be like "Source: ProximityOne; http://proximityone.com" Additional Information ProximityOne develops geographic-demographic-economic data and analytical tools and helps organizations knit together and use diverse data in a decision-making and analytical framework. We develop custom demographic/economic estimates and projections, develop geographic and geocoded address files, and assist with impact and geospatial analyses. Wide-ranging organizations use our tools (software, data, methodologies) to analyze their own data integrated with other data. Follow ProximityOne on Twitter at www.twitter.com/proximityone. Contact ProximityOne (888-364-7656) with questions about data covered in this section or to discuss custom estimates, projections or analyses for your areas of interest. |
|
|