
|
|
|
Integrating Demographic-Economic Data into GIS Projects -- application illustrations using the Hawaii2014 GIS Project
Add your selected subject matter to layers/shapefiles in your GIS project. Create maps and perform geospatial analysis using subject matter that you choose rather than only what exists. This section provides an overview of using the Demographic-Economic Data Extraction (DEDE software (companion to CV XE GIS software) to extract and integrate data for use with the Hawaii 2014 GIS project. See Hawaii 2014 GIS project main section. See DEDE main section. These operations are not specific to the Hawaii 2014 GIS project (independent of any specific GIS project) but are illustrated here in context of that project. The DEDE operations can select/extract data for any U.S. national scope geography. The DEDE Level 1 may be used to extract data only at the block group level. Use the Demographic Economic Data Extraction (DEDE) software to extract demographic-economic data from various statistical programs and datasets. This section is focused on using the DEDE Level 1 to extract block group level data from Census 2000, Census 2010, ACS 2010, ACS 2011 and ACS 2012. The Windows-based DEDE Level 1 software is available at no fee to ProximityOne User Group members. DEDE Level 1 processes block group level geography only (Census 2000 or Census 2010) Installation & Getting Started 1. Run DEDE installer (requires User Group ID) ... Windows-based computer 2. Start DEDE using desktop icon. 3. At start-up, click Run button to generate the default view. Running Hawaii applications (15003 2010 BGs; 590 areas). 1. Use File>Open Items File to open a subject matter items "control" file. ... c:\dede\items_acs.txt; later your own. 2. Use File>Open Geocodes File to open a geographic areas "control" file. ... c:\hawaii2014\geocodes_2010_bg_15003.txt; later your own. ... Honolulu County only; codes derived from TIGER shapefile. 3. Use File>Open Geocodes File to open a geographic areas "control" file. 4. Click Run button The DEDE user interface view now appears as shown below. The grid shows a row for each block group in Honolulu County. The columns correspond to the subject matter items listed in "items_acs.txt" (ACS 2010 5 year estimates) 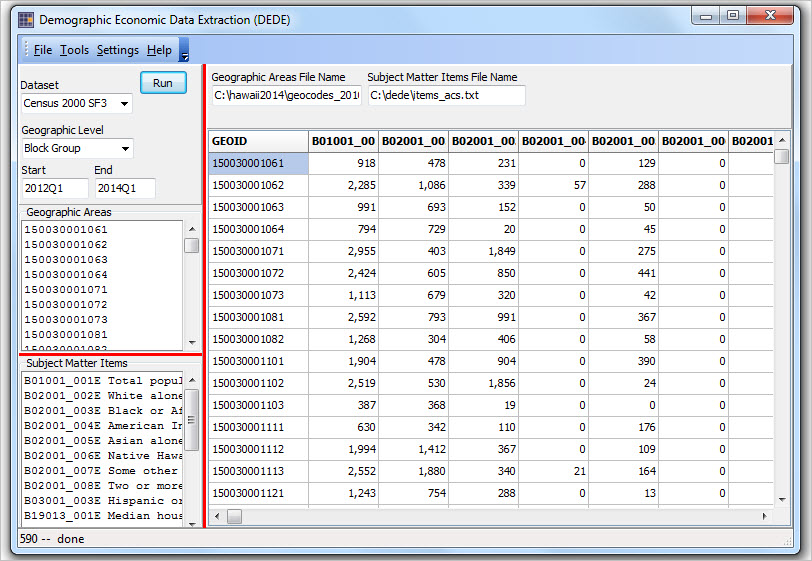 Click graphic for larger view. Saving and Using the DEDE Output File 1. Use File>Save File As to save the content of the grid to Excel or CSV. 2. The grid content is automatically saved as c:\dede\$newfile.dbf (dBASE file) Integrate the DEDE dBASE Output File into the Hawaii2014 Project Block Group Shapefile 1. Close DEDE. 2. Start CV XE GIS; do not use hawaii2014.gis project. 3. Use Database>dBMerge to merge DEDE dbf output into Hawaii block group shapefile (C:\hawaii2014\cb_2013_15_bg_500k.dbf) Operations reviewed in Web session. 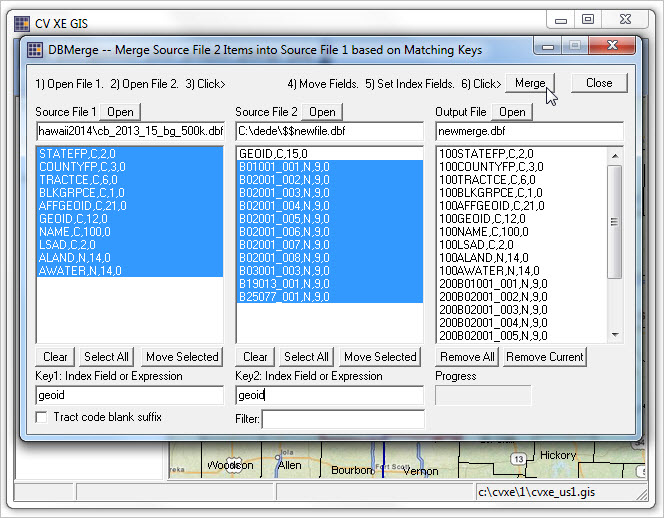 Click graphic for larger view. Map Results; Show Mini-Profile 1. Start CV XE GIS. 2. Use layer editor to modify the block group layer section attributes. 3. Uncheck other layers in legend panel; navigate to adjusted view. 4. Turn off block group layer labels. Save project? Discuss. Operations reviewed in Web session. 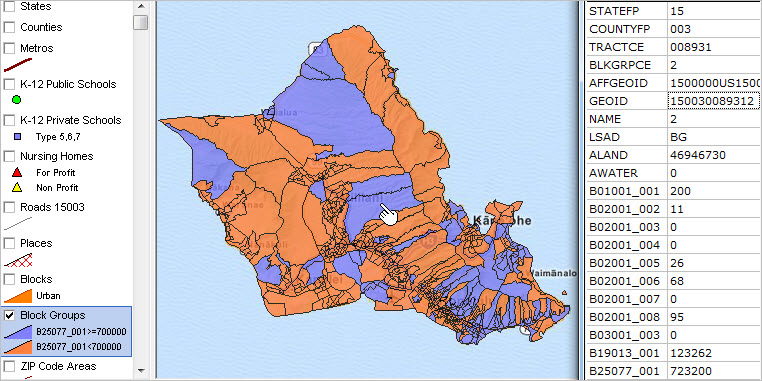 Click graphic for larger view. Support Using these Resources Learn more about demographic economic data and related analytical tools. Join us in a Decision-Making Information Web session. There is no fee for these one-hour Web sessions. Each informal session is focused on a specific topic. The open structure also provides for Q&A and discussion of application issues of interest to participants. ProximityOne User Group Join the ProximityOne User Group to keep up-to-date with new developments relating to geographic-demographic-economic decision-making information resources. Receive updates and access to tools and resources available only to members. Use this form to join the User Group. There is no fee. Terms of Use Resources described is this section may be accessed and used only by ProximityOne User Group members. There is no warranty of any type with regard to any aspect of these resources. Users are solely responsible for any use made. ProximityOne User Group resources are exclusively for use by registered members. The resources made not be redistributed. Usage rights are only with registered members and do not extend to any possible associated organization (e.g., a business, university, government agency). We request that reference be made to ProximityOne for usage made of the resources. A suggested reference would be like "Source: ProximityOne; http://proximityone.com" Additional Information ProximityOne develops geographic-demographic-economic data and analytical tools and helps organizations knit together and use diverse data in a decision-making and analytical framework. We develop custom demographic/economic estimates and projections, develop geographic and geocoded address files, and assist with impact and geospatial analyses. Wide-ranging organizations use our tools (software, data, methodologies) to analyze their own data integrated with other data. Follow ProximityOne on Twitter at www.twitter.com/proximityone. Contact ProximityOne (888-364-7656) with questions about data covered in this section or to discuss custom estimates, projections or analyses for your areas of interest. |
|
|