|
|
|
Analyzing Block Group Demographics
-- application illustrations using the Hawaii2014 GIS Project
Decision-Making Information

|
ProximityOne
information resources & solutions
(888) DMI-SOLN
(888) 364-7656
|
Visual analysis with ProximityOne tools
click graphic for info; hover to pause
Decision-Making Information Blog
Examining Diversity 1960-2060
Support & Technical Assistance
help using these resources
|
Census Block Groups sit in a "mid-range" geography between census blocks and census tracts.
All cover the U.S. wall-to-wall and nest together, census blocks being the lowest common denominator for each.
Block Groups (BGs) are the smallest geographic area for which annually updated
American Community Survey (BG) data are tabulated.
November 2014. Some parts of this section have been updated. See the following updated sections:
Hawaii 2014 GIS Project
• Profiles & Reports
• API Data Integration
• Site Analysis
Advantages of using BG geodemographics include the maximum degree of geographic drill-down ... enabling the
most micro-perspective of demographics for a neighborhood or part of study area.
Among the disadvantages of BG estimates (e.g., from ACS) is that typically the smaller area estimates have a relatively higher error
of estimate. But that is true only of the ACS data, and not the Census 2010 data which are not estimates and have no error
of estimation (though other types of errors may exist).
Hawaii Family Income Demographics by Census 2010 Block Group
- interactive table
- click column header to sort; click again to sort other direction.
- click ShowAll button between queries.
- see other demographic-economic ranking tables
Use the above table to view/query/rank/compare the distribution of family income by income category
by Census 2010 block group based on ACS 2010 5-year estimates.
Subject matter columns are described below. The data in the ranking table were developed using the ACS 2010
5-Year Estimates Tracts and Block Groups Summary File.
ACS 2010 5-year estimates; centric to mid-2008
Table B01003. Total population
Table B19013. Median Household Income
Table B19113. Median Family Income
Table B19101. Families by Income Range (family income in past 12 months
Families by income range:
Less than $10,000
$10,000 to $14,999
$15,000 to $19,999
$20,000 to $24,999
$25,000 to $29,999
$30,000 to $34,999
$35,000 to $39,999
$40,000 to $44,999
$45,000 to $49,999
$50,000 to $59,999
$60,000 to $74,999
$75,000 to $99,999
$100,000 to $124,999
$125,000 to $149,999
$150,000 to $199,999
$200,000 or more
Block Group Mapping & GIS Applications
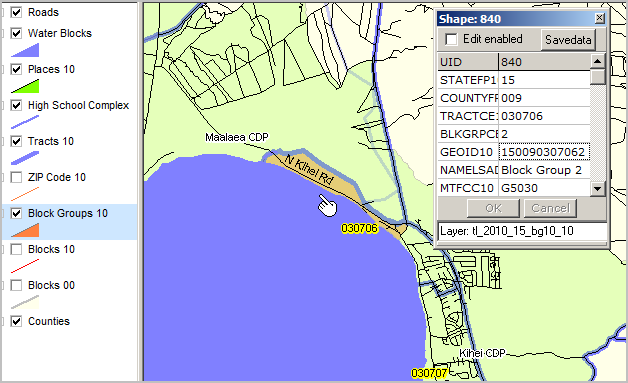
Ranking the above table on percent families with income over $200,000 (far right column) reveals that Maui tract 030706 block group 2
has 13 families all with income of $200,000 or more.
Using the
GIS Resources HI2012 GIS project, this area is shown in the graphic shown below (by pointer).
This block group is partly in Maalaea CDP and Kihei CDP (split by N Kihei Rd).
Hawaii BGs with the largest number of families with income over $200,000 are in Honolulu: 000402-2 (286),
000402-1 (266), and 000401-1 (204).
School Age Population by Block Group Pattern Analysis
The following applications illustrate use of block group geography and demographics in Honolulu County.
These applications are not directly related to data in the above ranking table.
Two thematic maps are shown and a related comparative analysis for selected block groups.
These applications make use only of Census 2010 geography and demographics.
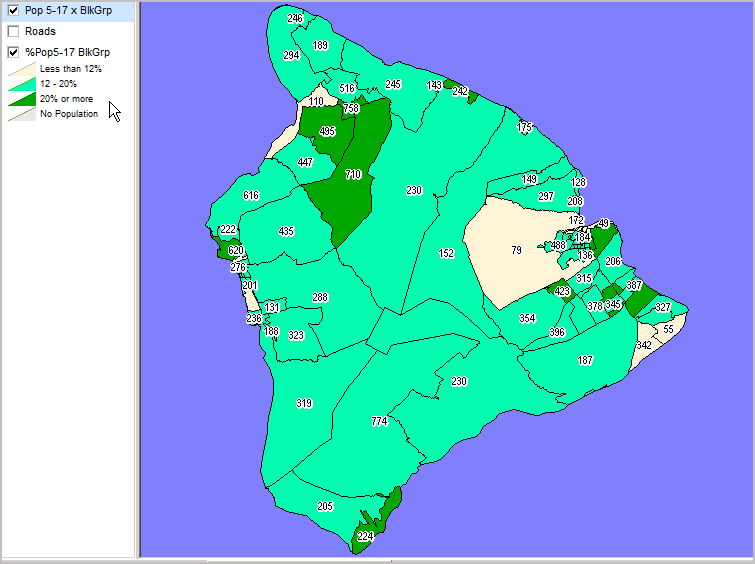
See map views of each Hawaii County by Block Group showing population ages 5-to-17 years ..
Hawaii ... Honolulu ... Kauai ... Maui/Kalawao.
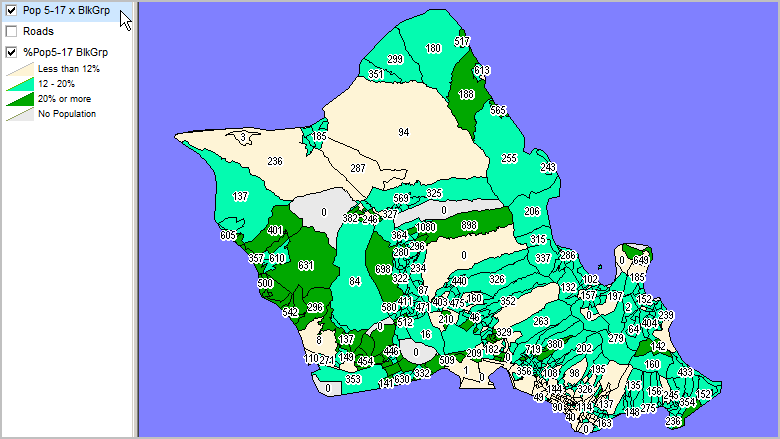
Percent School Age Population (ages 5 to 17 years) by Census 2010 Block Group
Legend at left of map view shows shows percent by color pattern.
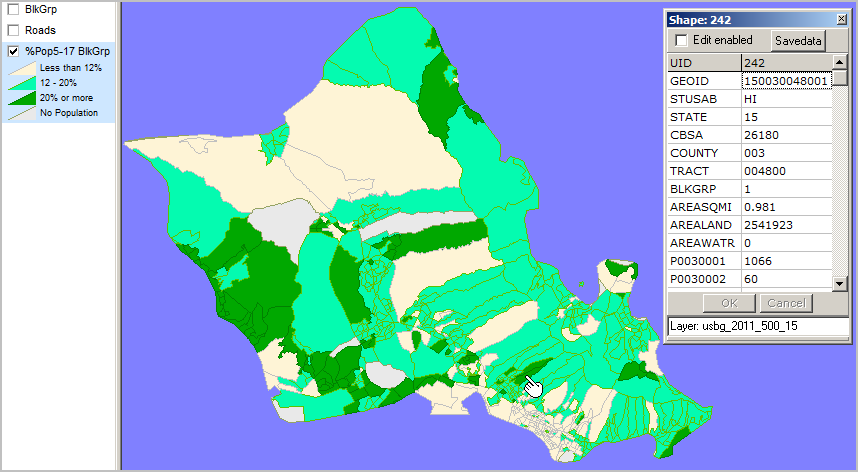
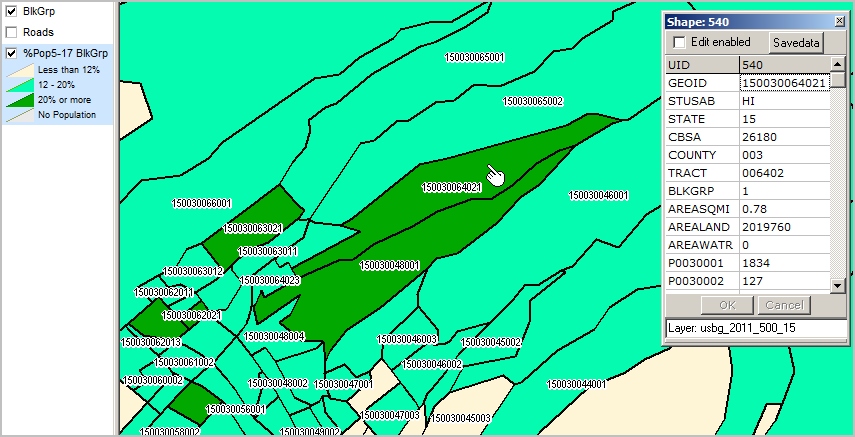
Zoom-in to Study Area -- see pointer in above view.
View developed with CV XE GIS and Block Group Shapefile with Integrated Demographics
Labels near pointer show block groups 15-003-006402-1 and 15-003-004800-1 (dashes not shown in map view)
Identify tool used to show mini-profile of selected block group.
Organized full comparative analysis profile shown below.
Census 2010 DP1 Comparative Analysis Profile
Profile developed using
Block Group Dataset
Profile shows selected block groups 15-003-006402-1 and 15-003-004800-1 in Honolulu County.
Three column sets: block groups 15-003-006402-1 and 15-003-004800-1 and their composite.
See these areas in map view context in the above graphic.
Use scroll bar at right to view entire table.
Census 2010 Demographic Profile DP1 --
ProximityOne -- see DDA Guide for more information.
| Geographic Area --> |
Block Group
15-003-004800-1 |
Block Group
15-003-006402-1 |
MultiArea Summary |
| Subject | Number | Percent | Number | Percent | Number | Percent |
| SEX AND AGE | | | | | | |
| Total population | 1,066 | 100.0 | 1,834 | 100.0 | 2,900 | 100.0 |
| Under 5 years | 41 | 3.8 | 123 | 6.7 | 164 | 5.7 |
| 5 to 9 years | 56 | 5.3 | 135 | 7.4 | 191 | 6.6 |
| 10 to 14 years | 155 | 14.5 | 146 | 8.0 | 301 | 10.4 |
| 15 to 19 years | 303 | 28.4 | 157 | 8.6 | 460 | 15.9 |
| 20 to 24 years | 32 | 3.0 | 128 | 7.0 | 160 | 5.5 |
| 25 to 29 years | 46 | 4.3 | 106 | 5.8 | 152 | 5.2 |
| 30 to 34 years | 39 | 3.7 | 104 | 5.7 | 143 | 4.9 |
| 35 to 39 years | 45 | 4.2 | 112 | 6.1 | 157 | 5.4 |
| 40 to 44 years | 57 | 5.3 | 121 | 6.6 | 178 | 6.1 |
| 45 to 49 years | 51 | 4.8 | 125 | 6.8 | 176 | 6.1 |
| 50 to 54 years | 40 | 3.8 | 143 | 7.8 | 183 | 6.3 |
| 55 to 59 years | 45 | 4.2 | 98 | 5.3 | 143 | 4.9 |
| 60 to 64 years | 46 | 4.3 | 87 | 4.7 | 133 | 4.6 |
| 65 to 69 years | 35 | 3.3 | 70 | 3.8 | 105 | 3.6 |
| 70 to 74 years | 18 | 1.7 | 57 | 3.1 | 75 | 2.6 |
| 75 to 79 years | 29 | 2.7 | 54 | 2.9 | 83 | 2.9 |
| 80 to 84 years | 12 | 1.1 | 39 | 2.1 | 51 | 1.8 |
| 85 years and over | 16 | 1.5 | 29 | 1.6 | 45 | 1.6 |
| Median age (years) | 18.6 | ... | 36.1 | ... | 27.4 | ... |
| 5 to 17 years | 475 | 44.6 | 380 | 20.7 | 855 | 29.5 |
| 18 years and over | 550 | 51.6 | 1,331 | 72.6 | 1,881 | 64.9 |
| 21 years and over | 506 | 47.5 | 1,247 | 68.0 | 1,753 | 60.4 |
| 62 years and over | 139 | 13.0 | 302 | 16.5 | 441 | 15.2 |
| 65 years and over | 110 | 10.3 | 249 | 13.6 | 359 | 12.4 |
| Male population | 508 | 47.7 | 922 | 50.3 | 1,430 | 49.3 |
| Under 5 years | 23 | 2.2 | 60 | 3.3 | 83 | 2.9 |
| 5 to 9 years | 25 | 2.3 | 76 | 4.1 | 101 | 3.5 |
| 10 to 14 years | 72 | 6.8 | 82 | 4.5 | 154 | 5.3 |
| 15 to 19 years | 130 | 12.2 | 81 | 4.4 | 211 | 7.3 |
| 20 to 24 years | 15 | 1.4 | 66 | 3.6 | 81 | 2.8 |
| 25 to 29 years | 30 | 2.8 | 48 | 2.6 | 78 | 2.7 |
| 30 to 34 years | 22 | 2.1 | 56 | 3.1 | 78 | 2.7 |
| 35 to 39 years | 17 | 1.6 | 52 | 2.8 | 69 | 2.4 |
| 40 to 44 years | 32 | 3.0 | 69 | 3.8 | 101 | 3.5 |
| 45 to 49 years | 26 | 2.4 | 65 | 3.5 | 91 | 3.1 |
| 50 to 54 years | 18 | 1.7 | 66 | 3.6 | 84 | 2.9 |
| 55 to 59 years | 28 | 2.6 | 52 | 2.8 | 80 | 2.8 |
| 60 to 64 years | 23 | 2.2 | 46 | 2.5 | 69 | 2.4 |
| 65 to 69 years | 17 | 1.6 | 31 | 1.7 | 48 | 1.7 |
| 70 to 74 years | 7 | 0.7 | 22 | 1.2 | 29 | 1.0 |
| 75 to 79 years | 9 | 0.8 | 23 | 1.3 | 32 | 1.1 |
| 80 to 84 years | 4 | 0.4 | 15 | 0.8 | 19 | 0.7 |
| 85 years and over | 10 | 0.9 | 12 | 0.7 | 22 | 0.8 |
| Median age (years) | 21.7 | ... | 34.2 | ... | 28.0 | ... |
| 5 to 17 years | 208 | 19.5 | 211 | 11.5 | 419 | 14.4 |
| 18 years and over | 277 | 26.0 | 651 | 35.5 | 928 | 32.0 |
| 21 years and over | 256 | 24.0 | 612 | 33.4 | 868 | 29.9 |
| 62 years and over | 60 | 5.6 | 129 | 7.0 | 189 | 6.5 |
| 65 years and over | 47 | 4.4 | 103 | 5.6 | 150 | 5.2 |
| Female population | 558 | 52.3 | 912 | 49.7 | 1,470 | 50.7 |
| Under 5 years | 18 | 1.7 | 63 | 3.4 | 81 | 2.8 |
| 5 to 9 years | 31 | 2.9 | 59 | 3.2 | 90 | 3.1 |
| 10 to 14 years | 83 | 7.8 | 64 | 3.5 | 147 | 5.1 |
| 15 to 19 years | 173 | 16.2 | 76 | 4.1 | 249 | 8.6 |
| 20 to 24 years | 17 | 1.6 | 62 | 3.4 | 79 | 2.7 |
| 25 to 29 years | 16 | 1.5 | 58 | 3.2 | 74 | 2.6 |
| 30 to 34 years | 17 | 1.6 | 48 | 2.6 | 65 | 2.2 |
| 35 to 39 years | 28 | 2.6 | 60 | 3.3 | 88 | 3.0 |
| 40 to 44 years | 25 | 2.3 | 52 | 2.8 | 77 | 2.7 |
| 45 to 49 years | 25 | 2.3 | 60 | 3.3 | 85 | 2.9 |
| 50 to 54 years | 22 | 2.1 | 77 | 4.2 | 99 | 3.4 |
| 55 to 59 years | 17 | 1.6 | 46 | 2.5 | 63 | 2.2 |
| 60 to 64 years | 23 | 2.2 | 41 | 2.2 | 64 | 2.2 |
| 65 to 69 years | 18 | 1.7 | 39 | 2.1 | 57 | 2.0 |
| 70 to 74 years | 11 | 1.0 | 35 | 1.9 | 46 | 1.6 |
| 75 to 79 years | 20 | 1.9 | 31 | 1.7 | 51 | 1.8 |
| 80 to 84 years | 8 | 0.8 | 24 | 1.3 | 32 | 1.1 |
| 85 years and over | 6 | 0.6 | 17 | 0.9 | 23 | 0.8 |
| Median age (years) | 17.9 | ... | 38.1 | ... | 28.0 | ... |
| 5 to 17 years | 267 | 25.0 | 169 | 9.2 | 436 | 15.0 |
| 18 years and over | 273 | 25.6 | 680 | 37.1 | 953 | 32.9 |
| 21 years and over | 250 | 23.5 | 635 | 34.6 | 885 | 30.5 |
| 62 years and over | 79 | 7.4 | 173 | 9.4 | 252 | 8.7 |
| 65 years and over | 63 | 5.9 | 146 | 8.0 | 209 | 7.2 |
| RACE | | | | | | |
| Total population | 1,066 | 100.0 | 1,834 | 100.0 | 2,900 | 100.0 |
| One Race | 576 | 54.0 | 1,448 | 79.0 | 2,024 | 69.8 |
| White | 60 | 5.6 | 127 | 6.9 | 187 | 6.4 |
| Black or African American | 2 | 0.2 | 6 | 0.3 | 8 | 0.3 |
| American Indian and Alaska Native | 0 | 0.0 | 1 | 0.1 | 1 | 0.0 |
| Asian | 364 | 34.1 | 1,091 | 59.5 | 1,455 | 50.2 |
| Native Hawaiian and Other Pacific Islander | 150 | 14.1 | 219 | 11.9 | 369 | 12.7 |
| Some Other Race | 0 | 0.0 | 4 | 0.2 | 4 | 0.1 |
| Two or More Races | 490 | 46.0 | 386 | 21.0 | 876 | 30.2 |
| HISPANIC OR LATINO AND RACE | | | | | | |
| Total population | 1,066 | 100.0 | 1,834 | 100.0 | 2,900 | 100.0 |
| Hispanic or Latino | 102 | 9.6 | 175 | 9.5 | 277 | 9.6 |
| White alone | 14 | 1.3 | 28 | 1.5 | 42 | 1.4 |
| Black or African American alone | 0 | 0.0 | 0 | 0.0 | 0 | 0.0 |
| American Indian and Alaska Native alone | 0 | 0.0 | 0 | 0.0 | 0 | 0.0 |
| Asian alone | 4 | 0.4 | 45 | 2.5 | 49 | 1.7 |
| Native Hawaiian and Other Pacific Islander alone | 6 | 0.6 | 10 | 0.5 | 16 | 0.6 |
| Some Other Race alone | 0 | 0.0 | 4 | 0.2 | 4 | 0.1 |
| Two or More Races | 78 | 7.3 | 88 | 4.8 | 166 | 5.7 |
| Not Hispanic or Latino | 964 | 90.4 | 1,659 | 90.5 | 2,623 | 90.4 |
| White alone | 46 | 4.3 | 99 | 5.4 | 145 | 5.0 |
| Black or African American alone | 2 | 0.2 | 6 | 0.3 | 8 | 0.3 |
| American Indian and Alaska Native alone | 0 | 0.0 | 1 | 0.1 | 1 | 0.0 |
| Asian alone | 360 | 33.8 | 1,046 | 57.0 | 1,406 | 48.5 |
| Native Hawaiian and Other Pacific Islander alone | 144 | 13.5 | 209 | 11.4 | 353 | 12.2 |
| Some Other Race alone | 0 | 0.0 | 0 | 0.0 | 0 | 0.0 |
| Two or More Races | 412 | 38.6 | 298 | 16.2 | 710 | 24.5 |
| RELATIONSHIP | | | | | | |
| Total population | 1,066 | 100.0 | 1,834 | 100.0 | 2,900 | 100.0 |
| In households | 546 | 51.2 | 1,829 | 99.7 | 2,375 | 81.9 |
| Householder | 124 | 11.6 | 339 | 18.5 | 463 | 16.0 |
| Spouse [6] | 81 | 7.6 | 237 | 12.9 | 318 | 11.0 |
| Child | 163 | 15.3 | 692 | 37.7 | 855 | 29.5 |
| Other relatives | 69 | 6.5 | 330 | 18.0 | 399 | 13.8 |
| Nonrelatives | 44 | 4.1 | 124 | 6.8 | 168 | 5.8 |
| In group quarters | 520 | 48.8 | 5 | 0.3 | 525 | 18.1 |
| Institutionalized population | 0 | 0.0 | 0 | 0.0 | 0 | 0.0 |
| Noninstitutionalized population | 520 | 48.8 | 5 | 0.3 | 525 | 18.1 |
| HOUSEHOLDS BY TYPE | | | | | | |
| Total households | 160 | 100.0 | 405 | 100.0 | 565 | 100.0 |
| Family households (families) [7] | 124 | 77.5 | 339 | 83.7 | 463 | 81.9 |
| Husband-wife family | 81 | 50.6 | 237 | 58.5 | 318 | 56.3 |
| Male householder, no wife present | 12 | 7.5 | 25 | 6.2 | 37 | 6.5 |
| Female householder, no husband present | 31 | 19.4 | 77 | 19.0 | 108 | 19.1 |
| Nonfamily households [7] | 36 | 22.5 | 66 | 16.3 | 102 | 18.1 |
| Householder living alone | 24 | 15.0 | 47 | 11.6 | 71 | 12.6 |
| Average household size | 3.41 | ... | 4.52 | ... | 3.96 | ... |
| Average family size [7] | 3.52 | ... | 4.71 | ... | 4.11 | ... |
| HOUSING OCCUPANCY | | | | | | |
| Total housing units | 164 | 100.0 | 417 | 100.0 | 581 | 100.0 |
| Occupied housing units | 160 | 97.6 | 405 | 97.1 | 565 | 97.2 |
| Vacant housing units | 4 | 2.4 | 12 | 2.9 | 16 | 2.8 |
| For rent | 0 | 0.0 | 3 | 0.7 | 3 | 0.5 |
| Rented, not occupied | 1 | 0.6 | 0 | 0.0 | 1 | 0.2 |
| For sale only | 1 | 0.6 | 4 | 1.0 | 5 | 0.9 |
| Sold, not occupied | 0 | 0.0 | 1 | 0.2 | 1 | 0.2 |
| For seasonal, recreational, or occasional use | 0 | 0.0 | 1 | 0.2 | 1 | 0.2 |
| All other vacants | 2 | 1.2 | 3 | 0.7 | 5 | 0.9 |
| Homeowner vacancy rate (percent) [8] | 1.0 | ... | 1.5 | ... | 1.3 | ... |
| Rental vacancy rate (percent) [9] | 0.0 | ... | 2.1 | ... | 1.0 | ... |
| HOUSING TENURE | | | | | | |
| Occupied housing units | 160 | 100.0 | 405 | 100.0 | 565 | 100.0 |
| Owner-occupied housing units | 96 | 60.0 | 265 | 65.4 | 361 | 63.9 |
| Population in owner-occupied housing units | 303 | 28.4 | 1,196 | 65.2 | 1,499 | 51.7 |
| Average household size of owner-occupied units | 3.16 | ... | 4.51 | ... | 3.83 | ... |
| Renter-occupied housing units | 64 | 40.0 | 140 | 34.6 | 204 | 36.1 |
| Population in renter-occupied housing units | 243 | 22.8 | 633 | 34.5 | 876 | 30.2 |
| Average household size of renter-occupied units | 7.60 | ... | 9.04 | ... | 8.32 | ... |
Some notes shown below may not appear in profile depending on geographic selections.
[1] Other Asian alone, or two or more Asian categories.
[2] Other Pacific Islander alone, or two or more Native Hawaiian and Other Pacific Islander categories.
[3] One of the four most commonly reported multiple-race combinations nationwide in Census 2000.
[4] In combination with one or more of the other races listed. The six numbers may add to more than the total population, and the six percentages may add to more than 100 percent because individuals may report more than one race.
[5] This category is composed of people whose origins are from the Dominican Republic, Spain, and Spanish-speaking Central or South American countries. It also includes general origin responses such as "Latino" or "Hispanic."
[6] "Spouse" represents spouse of the householder. It does not reflect all spouses in a household. Responses of "same-sex spouse" were edited during processing to "unmarried partner."
[7] "Family households" consist of a householder and one or more other people related to the householder by birth, marriage, or adoption. They do not include same-sex married couples even if the marriage was performed in a state issuing marriage certificates for same-sex couples. Same-sex couple households are included in the family households category if there is at least one additional person related to the householder by birth or adoption. Same-sex couple households with no relatives of the householder present are tabulated in nonfamily households. "Nonfamily households" consist of people living alone and households which do not have any members related to the householder.
[8] The homeowner vacancy rate is the proportion of the homeowner inventory that is vacant "for sale." It is computed by dividing the total number of vacant units "for sale only" by the sum of owner-occupied units, vacant units that are "for sale only," and vacant units that have been sold but not yet occupied; and then multiplying by 100.
[9] The rental vacancy rate is the proportion of the rental inventory that is vacant "for rent." It is computed by dividing the total number of vacant units "for rent" by the sum of the renter-occupied units, vacant units that are "for rent," and vacant units that have been rented but not yet occupied; and then multiplying by 100. |
Hawaii County by Census 2010 Block Group -- labels show Census 2010 population ages 5-17 years
Honolulu County by Census 2010 Block Group -- labels show Census 2010 population ages 5-17 years
Kauai County by Census 2010 Block Group -- labels show Census 2010 population ages 5-17 years

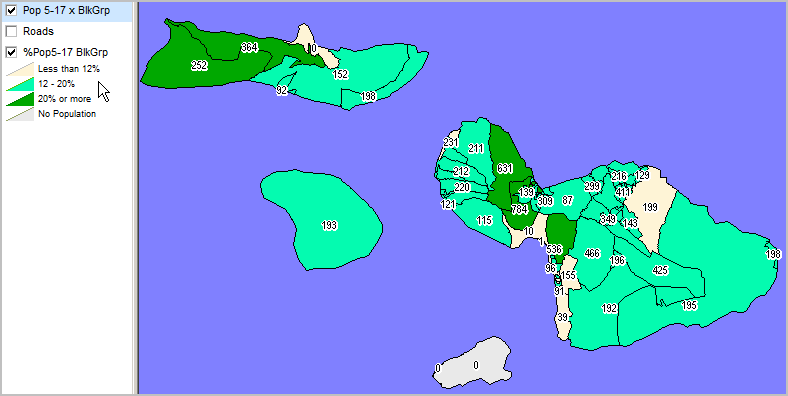
Maui County by Census 2010 Block Group -- labels show Census 2010 population ages 5-17 years
Support Using these Resources
Learn more about demographic economic data and related analytical tools.
Join us in a Decision-Making Information Web session.
There is no fee for these one-hour Web sessions.
Each informal session is focused on a specific topic.
The open structure also provides for Q&A and discussion of application issues of interest to participants.
ProximityOne User Group
Join the ProximityOne User Group
to keep up-to-date with new developments relating to geographic-demographic-economic decision-making information resources.
Receive updates and access to tools and resources available only to members.
Use this form to join the User Group.
There is no fee.
Additional Information
ProximityOne develops geographic-demographic-economic data and analytical tools and helps organizations knit together and use diverse data in a decision-making and analytical framework. We develop custom demographic/economic estimates and projections, develop geographic and geocoded address files, and assist with impact and geospatial analyses.
Wide-ranging organizations use our tools (software, data, methodologies) to analyze their own data integrated with other data.
Follow ProximityOne on Twitter at
www.twitter.com/proximityone.
Contact ProximityOne (888-364-7656) with questions about data covered in this section or to discuss custom estimates, projections or analyses for your areas of interest.
|
