
|
|
|
This section provides access to Census 2000, Census 2010 and related demographics for Hawaii High School Complexes (HSCs) as defined by the Hawaii Department of Education. Census 2010 data were not tabulated by the Census Bureau for Hawaii HSC areas. HSC Census 2010 demographics accessible here have been developed using geographic information system tools, Census 2000 and Census 2010 census block shapefiles, Census 2000 to Census 2010 census block relationship data, and Census 2010 census block demographics. As of Census 2010, Kaimuki (Oahu) was the largest HSC with total population of 84,204. HSCs with largest population growth from 2000 to 2010, included Kapolei (Oahu) 54% increase and Keaau (Hawaii) 50% increase. Use the interactive ranking table in this section to examine these types of patterns. High School Complex Demographic Comparative Analysis Profiles Use the companion interactive Web-based Hawaii Demographic-Economic Statistical System to view a demographic comparative analysis profile for any high school complex side-by-side with any other high school complex area or other geographic area (U.S., Hawaii or any Hawaii county, congressional district, city/place, census tract or ZIP code area). High School Complex Demographic Change 2000-2010 - interactive ranking table - click column header to sort; click again to sort other direction. - click ShowAll button between queries. - see other demographic-economic ranking tables High School Complex Geography and Demographics High School Complex (HSC) areas cover the State of Hawaii and were mapped for Census 2000. Demographic data were tabulated for Census 2000 HSCs as a part of the Census 2000 School District Special Tabulation. HSC boundaries were not developed for Census 2010 and thus not a part of the Census 2010 vintage Census 2010 TIGER shapefiles (the Census 2000 boundaries are shown in the Census 2010 vintage Census 2000 TIGER shapefiles). The Census Bureau did not tabulate Census 2010 data for HSCs. ProximityOne developed the Census 2010 demographics for HSCs by aggregating Census 2010 part or whole block demographics comprising each HSC and then aggregated to the HSC total area. Census blocks are the smallest geographic area for which decennial census data are tabulated. Census block geography and demographics are used to develop Census 2010 HSC demographics. See additional information about small area geography and demographics: census tracts, block groups, and census blocks. These geographies are defined (boundaries, names. etc.) by the TIGER/Line shapefiles. See these GIS views illustrating use of TIGER/Line shapefiles for Hawaii tract to block to intersection applications. The Census 2010 High School Complex demographics were developed for the boundaries defined as of Census 2000. Using Census 2000 TIGER/Line shapefiles, the Census 2000 census blocks comprising each HSC were determined. Census 2010 HSC demographics were tabulated using the "Census 2000 tabulation block to Census 2010 tabulation block" relationship file. Census 2010 demographic attributes for each part of a Census 2010 census block comprising an HSC were tabulated based on the proportion of intersecting census block area. Census 2000 & Census 2010 Block Relationships The following view of Lanai HSC (coterminous with Maui Census 2010 Census Tract 316.01) illustrates the relation between Census 2000 (gray boundaries) and Census 2010 (red boundaries) census blocks. The pointer is used to show a mini-profile for Census 2010 census block 1045 located in tract 316.01 (large coastal block). Comparing the number of Census 2010 census block boundaries in this area to the gray Census 2000 census block boundary in this area (see just above pointer) shows the extensive new/added census blocks since Census 2000. 
Accuracy of HSC Tabulations. Most HSCs are not coterminous with a set of whole census tracts, so it is difficult to compare census tract demographics tabulated by the Census Bureau to Census 2010 HSC demographics. One exception is in Maui. The Lanai (Maui) HSC is coterminous with Census 2010 Maui census tract 316.01. Examine how accurately the methodology estimates characteristics of an HSC. The default geographic selections (above) are set to Maui census tract 316.01 and Lanai HSC. Examine how closely the data are for the census tract and the HSC. One other area that is also feasible to examine is East Kauai/Kaapa (Kauai) HSC. This HSC is comprised of seven Census 2010 census tracts. Values of aggregate census tract demographics is near identical to those of East Kauai/Kaapa HSC. Extensions to Existing Data Some HSC cells shown in the profiles are not yet available and are shown with "..." notation. Some of these values will be added but some may remain unavailable. Data for all other geography shown in this section were developed making use of Census 2010 PCT and HCT tables. Data for PCT and HCT tables are not available at the census block level. Geographic Reference Maps Examine geographic relationships, boundaries and codes used in this section using the Hawaii2014 GIS project. Illustrative view of Oahu HSCs 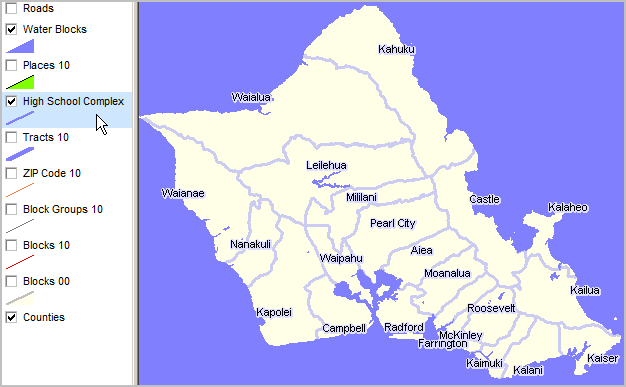
Support Using these Resources Learn more about demographic economic data and related analytical tools. Join us in a Decision-Making Information Web session. There is no fee for these one-hour Web sessions. Each informal session is focused on a specific topic. The open structure also provides for Q&A and discussion of application issues of interest to participants. ProximityOne User Group Join the ProximityOne User Group to keep up-to-date with new developments relating to geographic-demographic-economic decision-making information resources. Receive updates and access to tools and resources available only to members. Use this form to join the User Group. There is no fee. Additional Information ProximityOne develops geographic-demographic-economic data and analytical tools and helps organizations knit together and use diverse data in a decision-making and analytical framework. We develop custom demographic/economic estimates and projections, develop geographic and geocoded address files, and assist with impact and geospatial analyses. Wide-ranging organizations use our tools (software, data, methodologies) to analyze their own data integrated with other data. Follow ProximityOne on Twitter at www.twitter.com/proximityone. Contact ProximityOne (888-364-7656) with questions about data covered in this section or to discuss custom estimates, projections or analyses for your areas of interest. |
|
|