
|
|
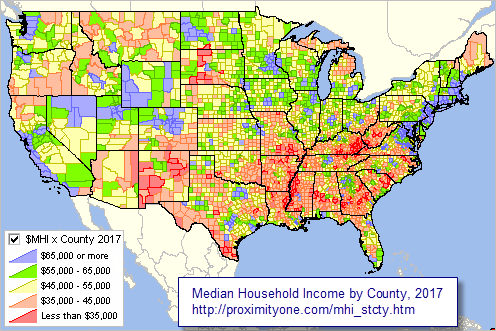
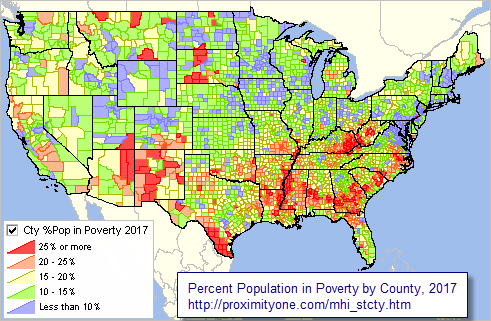
-- model-based estimates: housing units, household income, poverty -- examining patterns in annual household income & poverty by age, 2015-2017 October 2019. In 2017, 11.3 percent of counties had a statistically significant increase in median household income (MHI) compared to 2007, the year before the most recent recession, while 7.5 percent had a statistically significant decrease. County-level median household income estimates ranged from $22,645 to $136,191, with a median income of $48,886 for all counties in 2017. Between 2016 and 2017, 7.3 percent of counties had a statistically significant increase, while 3.1 percent had a statistically significant decrease. Examine MHI patterns and poverty incidence by state and county using the interactive table below. Official Model-Based Estimates. The household income data are model-based estimates, Census-sourced official estimates updated annually. This is the only source of annual median household income estimates for all counties. Data from the American Community Survey (ACS 2018) cover only 638 counties. The related ACS 2018 5-year estimates are for a five year period and centric to 2016 (becoming available 12/19). This section updates in December 2019 with data (new 2018 model-based estimates) for the period 2015-2018. Importance. These data are essential for businesses, policy-making, program evaluation, allocation of resources, research .. mong many other uses. While the median household income is a single measure, and should be used with other data, it is one of a handful of key measures that tells us where and when economic prosperity is changing and how that change might affect decision-making. County-level granuality is important as MHI characteristics are often masked or not geographically relevant at the state level. Related Real MHI by State. See the related U.S. & States Real Median Household Income section focused on real median household income annual time series data, based on ACS 1-year data, for the period 2005-2018 (updated September 2019; updates next in September 2020). Use the interactive table below and related Geographic Information System (GIS) resources to examine income trends and geographic patterns. See details on using GIS project below. ProximityOne uses these data to develop current estimates and projections. Access these data through the ProximityOne Data Service tools. See related MHI sections below. Patterns of Median Household Income by County, 2017 -- click link for larger view; expand browser window for best quality view.  - view developed using ProximityOne CV XE GIS and related GIS project. - geospatial analyze income characteristics integrated with your data to examine patterns; gain insights. Patterns of Population in Poverty by County, 2017 -- click link for larger view; expand browser window for best quality view.  - view developed using ProximityOne CV XE GIS and related GIS project. - develop/geospatially analyze poverty incidence for different age groups, inlcuded in the GIS project. - geospatial analyze poverty/income characteristics integrated with your data to examine patterns; gain insights. U.S., State & County Household Income & Poverty; 2015-2017 -- Interactive Table median household income, population in poverty by age and housing units. click column header to sort; click again to sort other direction. See usage notes below table. See related Related Interactive Tables Usage Notes • Click "Selected Cols" below table to view change and trend columns. Items included in table and GIS project .. scroll section
- AreaName
- StAb - USPS state abbreviation - St - State FIPS code - Cty - County FIPS code - StCty - State + County FIPS code - CBSA 2018 - Core-Based Statistical Area code --2018 vontage - MHI 2015 - MHI 2016 - MHI 2017 - MHI Ch 2015-17 - MHI %Ch 2015-17 - Hsg Units 2015 - Hsg Units 2016 - Hsg Units 2017 - Hsg Units 2018 - Hsg Units Chg 2015-18 - Hsg Units %Chg 2015-18 - Pop in Poverty 2015 - %Pop in Poverty 2015 - Pop in Poverty 2016 - %Pop in Poverty 2016 - Pop in Poverty 2017 - %Pop in Poverty 2017 - Pop 0-17 in Poverty 2015 - %Pop 0-17 in Poverty 2015 - Pop 0-17 in Poverty 2016 - %Pop 0-17 in Poverty 2016 - Pop 0-17 in Poverty 2017 - %Pop 0-17 in Poverty 2017 - Pop 5-17 in Poverty 2015 - %Pop 5-17 in Poverty 2015 - Pop 5-17 in Poverty 2016 - %Pop 5-17 in Poverty 2016 - Pop 5-17 in Poverty 2017 - %Pop 5-17 in Poverty 2017 Steps to Develop Custom MHI Pattern Analysis Maps (requires Windows computer with Internet connection) 1. Install the ProximityOne CV XE GIS ... run the CV XE GIS installer ... take all defaults during installation 2. Download the MHI GIS project fileset ... requires UserID ... unzip MHI GIS project files to local folder c:\mhitrends 3. Open the c:\mhitrends\mhitrends.gis project ... after completing the above steps, click File>Open>Dialog ... open the file named c:\mhitrends\mhitrends.gis 4. Done. The start-up view is shown at top of this section. Related MHI Sections .. goto top • Corresponding Blog Post • County Household Income & Income Inequality Patterns • Median Household Income by State & County .. U.S. by county annual model based estimates (updates in October & December) Terms & Concepts .. goto top Household income. Household income includes income of the householder and all other people 15 years and older in the household, whether or not they are related to the householder. Median. The median is that value that divides the household income distribution into halves, one-half with income above the median and the other with income below the median. The median is based on the income distribution of all households, Real Income. Income data presented here inflation-adjusted to 2018 dollars. Real income refers to income after adjusting for inflation. Inflation adjustments are computed using the CPI-U-RS. ProximityOne User Group ... goto top Join the ProximityOne User Group to keep up-to-date with new developments relating to metros and component geography decision-making information resources. Receive updates and access to tools and resources available only to members. Use this form to join the User Group. Support Using these Resources Learn more about accessing and using demographic-economic data and related analytical tools. Join us in a Data Analytics Lab session. There is no fee for these one-hour Web sessions. Each informal session is focused on a specific topic. The open structure also provides for Q&A and discussion of application issues of interest to participants. Additional Information ProximityOne develops geodemographic-economic data and analytical tools and helps organizations knit together and use diverse data in a decision-making and analytical framework. We develop custom demographic/economic estimates and projections, develop geographic and geocoded address files, and assist with impact and geospatial analyses. Wide-ranging organizations use our tools (software, data, methodologies) to analyze their own data integrated with other data. Follow ProximityOne on Twitter at www.twitter.com/proximityone. Contact us (888-364-7656) with questions about data covered in this section or to discuss custom estimates, projections or analyses for your areas of interest. |
|
|