
|
|
|
Nursing Home Characteristics & Patterns
November 2014. There are now approximately 16,500 operational nursing homes in the U.S. This section provides access to data about individual nursing homes in context with related geographic, demographic and economic data. Soon this section will be updated with a national scope interactive table (see related tables). Download and use a GIS project to examine how these data can be used for visual and geospatial analysis. See about the Hawaii GIS project that integrates nursing home data in shapefile structure. See about nursing homes and long-term care facilities. Join us in a Web session (Healthcare Analytics) focused on using these data in combination with other data. Characteristics of the Nursing Home Population Learn more about the nursing home population by selected type of geographic area using the American Community Survey data (see ACS 2013). The nursing home population is categorized as a group quarters population in the ACS. The ACS provides many other nursing related data such as population by occupation in nursing and other healthcare occupations. Non-profit Nursing Homes 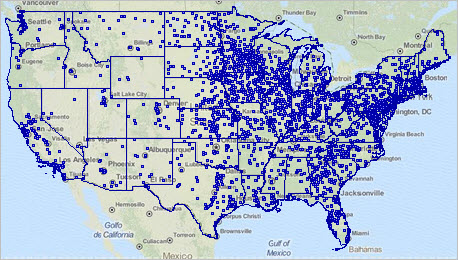 View created using CV XE GIS. For Profit Nursing Homes 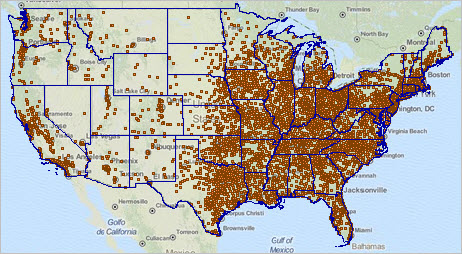 View created using CV XE GIS. Using the Site Analysis Tool -- Characteristics of Nursing Homes in Vicinity of a Location 20 Nursing homes within 12 miles of MD Anderson -- Houston/Bay Area Texas (see pointer in map at red marker) • 2,514 Certified Beds (BEDCERT) • 1,949 Residents in Certified Beds (RESTOT) • 73.8 Total Nurse Staffing Hours per Resident per Day (TOTHRD) -- sum for all facilities 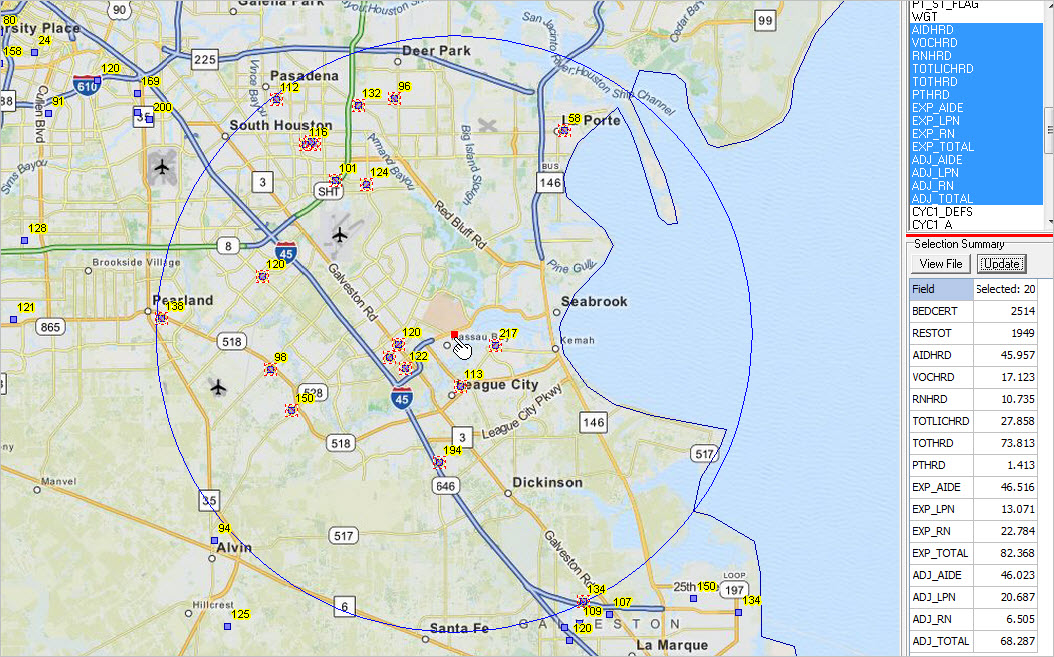 View created using CV XE GIS. Click graphic for larger view. Use the GIS SiteAnalysis tool to choose your own location and set your desired radius. Choose multiple areas not just those in one circular area. Flexibly select attributes of a set of one or many nursing homes and view tabular summary characteristics. Table showing list view of selected 20 facilities 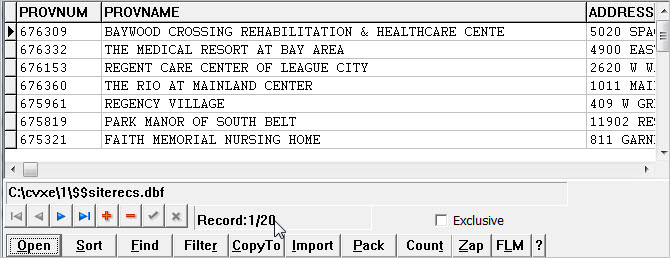
Profile of a selected facility (see pointer) 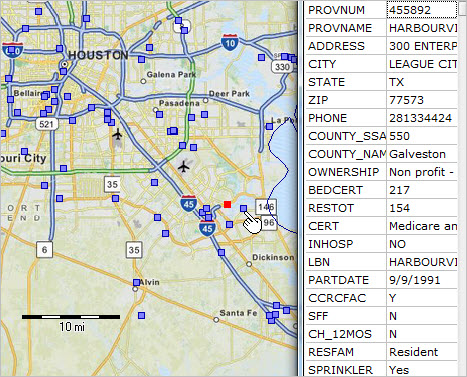
Nursing homes and Long-term Care Facilities Nursing homes are one component of long-term care facilities and infrastructure. In 2012, there were approximately 58,500 paid, regulated long-term care services providers in the United States, including 4,800 adult day services centers, 12,200 home health agencies, 3,700 hospices, 15,700 nursing homes, and 22,200 residential care communities. In total, long-term care services providers in these five sectors served about 8,357,100 people annually. 2012 estimates show there were 273,200 participants enrolled in adult day services centers, 1,383,700 residents living in nursing homes, and 713,300 residents living in residential care communities. In 2011, about 4,742,500 patients received services from home health agencies, and 1,244,500 patients received services from hospices. See additional information. Support Using these Resources Learn more about demographic economic data and related analytical tools. Join us in a Decision-Making Information Web session. There is no fee for these one-hour Web sessions. Each informal session is focused on a specific topic. The open structure also provides for Q&A and discussion of application issues of interest to participants. ProximityOne User Group Join the ProximityOne User Group to keep up-to-date with new developments relating to geographic-demographic-economic decision-making information resources. Receive updates and access to tools and resources available only to members. Use this form to join the User Group. There is no fee. Additional Information ProximityOne develops geographic-demographic-economic data and analytical tools and helps organizations knit together and use diverse data in a decision-making and analytical framework. We develop custom demographic/economic estimates and projections, develop geographic and geocoded address files, and assist with impact and geospatial analyses. Wide-ranging organizations use our tools (software, data, methodologies) to analyze their own data integrated with other data. Follow ProximityOne on Twitter at www.twitter.com/proximityone. Contact ProximityOne (888-364-7656) with questions about data covered in this section or to discuss custom estimates, projections or analyses for your areas of interest. |
|
|