
|
|
|
... software tool to view/analyze Outlook 2020 Estimates & Projections Access U.S. by county annual demographic estimates and projections, 2010 through 2020, by using the Outlook 2020 interactive table. A Web page is displayed showing the population by 5 year age cohort other age groups and by year for the selected county. The Outlook2020 Trend Analysis Windows-based software, described in this section, enables analysis of the Outlook 2020 estimates and projections. The software greatly enhances what can be done using only the Web-based viewer. 1. display the estimates and projections in a grid, similar to the Web page display. 2. show annual age-cohort population data as a percent of total population. 3. save the grid display of population or percent data as an Excel file. 4. select two or more counties and aggregate the data for the composite area. 5. create percentage views and save to Excel just like for a single county. -- features 4 and 5 enable aggregation of the estimates & projections to a metro or part metro. 6. use a metro listbox to automatically select all metro counties. 7. use CompareAreas feature to compare any one area with another area, optionally multi-county. 8. all U.S. counties and all metros are supported. Start-up View Start Outlook2020 using the desktop icon. The start-up view appears as shown below. The start-up view illustrates one of the basic features of the application. Johnson County, KS is selected in the lower left listbox. When this selection is run (dbl-click the county name), the total population by age profile is displayed in the grid. The leftmost column shows age group. The remaining columns show annual population estimates and projections to 2020. The year is shown in the top cell of the column. 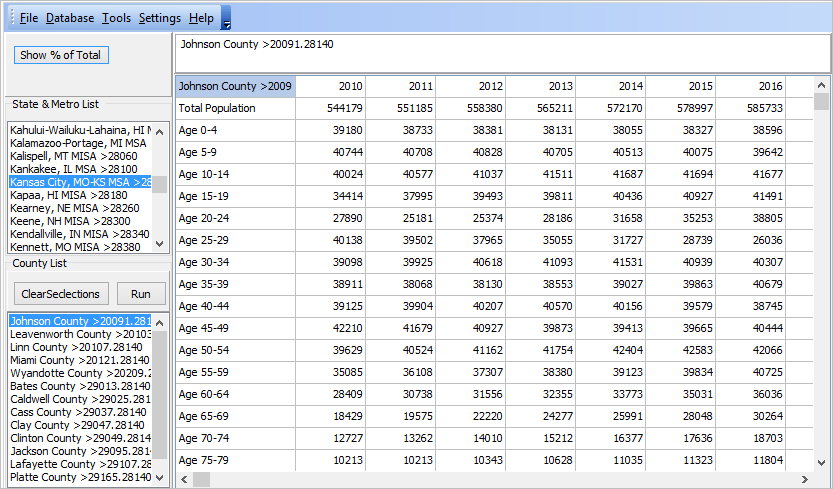 Click graphic for larger view. Percent of Total by Year Click the "Show % of Total" button to view cells as a percent of total population. 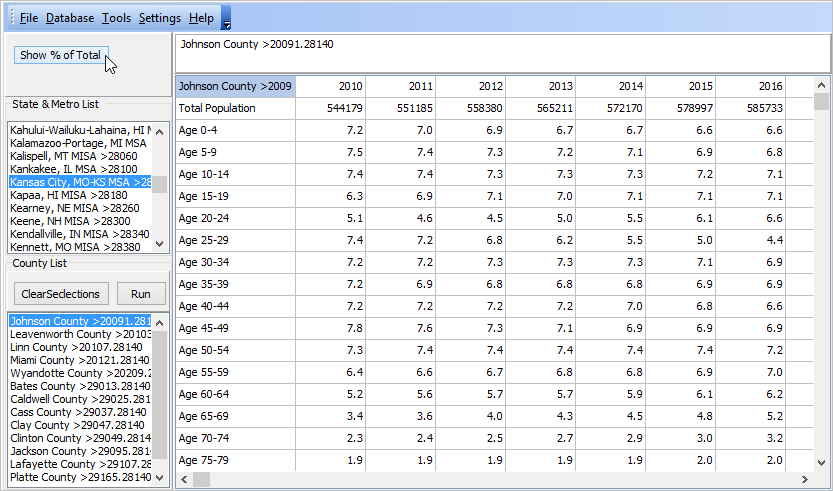 Click graphic for larger view. Select/Sum all Counties in a Metro In this view, the Phoenix, AZ metro is dbl-clicked in metro listbox. The two component counties are displayed in the lower/county listbox. Multi-selecting both counties, the Run button is clicked. The grid refreshes with the sum of both counties, or the metro total. Perform a similar application for any metro. 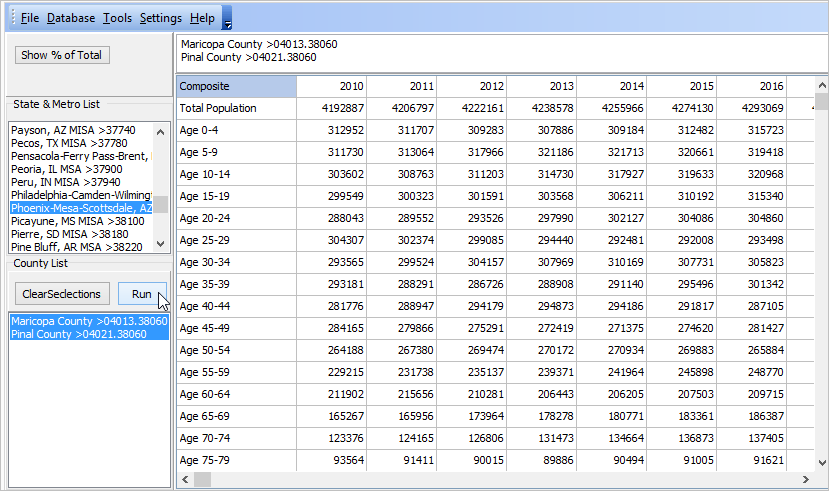 Click graphic for larger view. Saving Grid to Excel File -- the Metro In this view, the File>SaveGridAs feature is used to save the current grid cells to an Excel file. The file was saved as c:\outlook2020\phoenix_metro.xls; it will be used in a comparative analysis reviewed below. 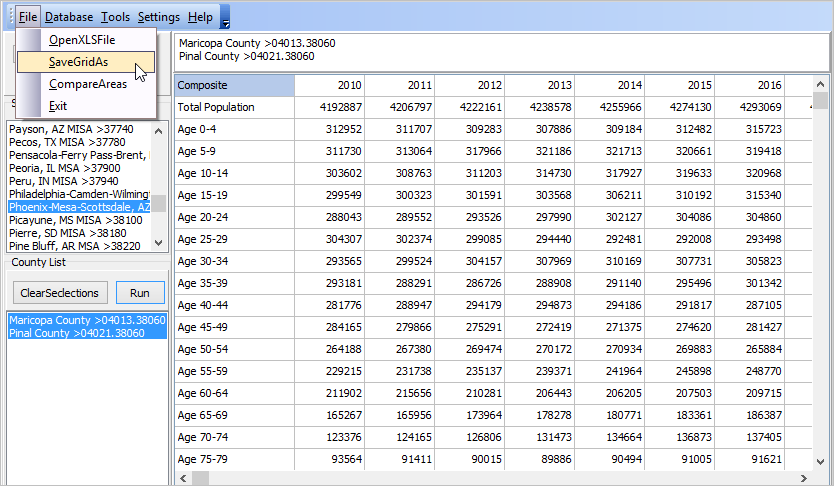 Click graphic for larger view. Grid to Excel File -- a Metro Component County In this view, the File>SaveGridAs feature is used to save the current grid cells to an Excel file. Maricopa County is dbl-clicked; the grid populates with population values for this one county. The file was saved as c:\outlook2020\maricopa.xls; it will be used in a comparative analysis reviewed below. 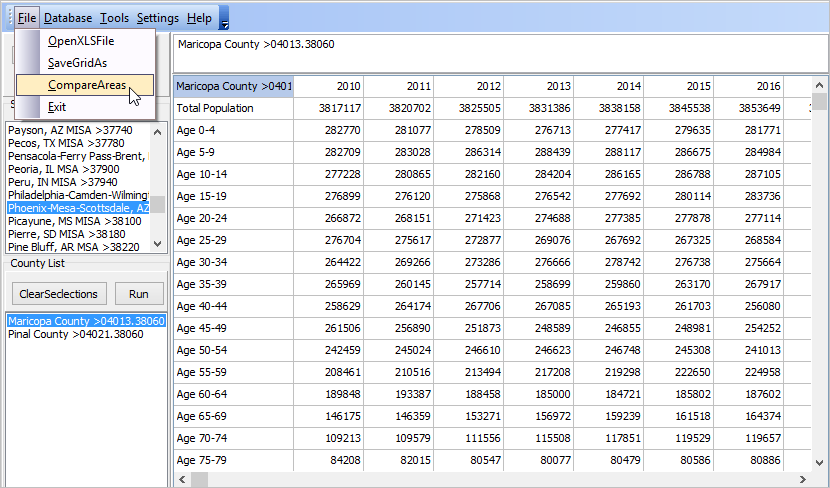 Click graphic for larger view. Comparative Analysis What part of the Phoenix metro is comprised by Maricopa County? The File>Comparative Analysis feature is used to compare Maricopa County (the numerator by cell) to the Phoenix metro (the denominator by cell). The following view shows that Maricopa County comprises 89.7 percent of the Phoenix metro population ages 0-4 years. The percent of this age group accounted for this county as a percent of total metro is slowly declining since 2010. Smaller Pinal County has a relatively increasing rate for this age group. 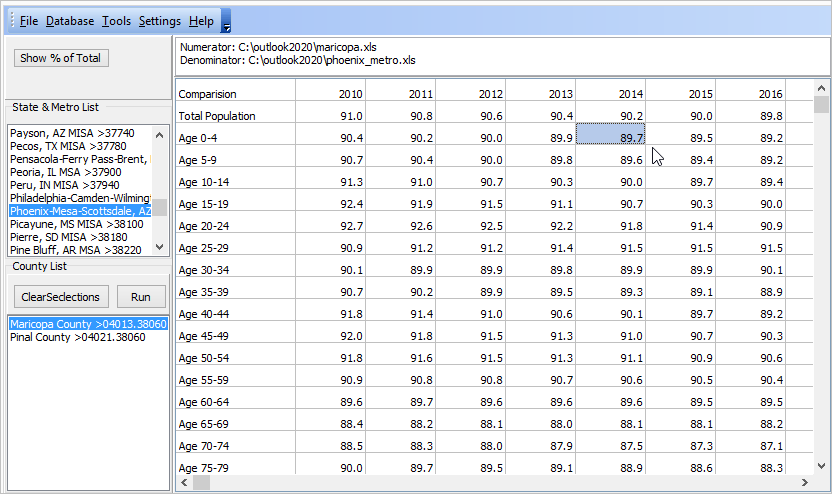 Click graphic for larger view. Steps to Prepare a Comparative Analysis 1. Develop the "numerator" area grid display. 2. Use File>SaveGridAs and save this grid display to an Excel file with a meaningful name (e.g., Harris.xls) 3. Develop the "denominator" area grid display. 4. Use File>SaveGridAs and save this grid display to an Excel file with a meaningful name (e.g., Houston_metro.xls) 5. Start File>CompareAreas and follow prompts. 6. When prompted to open numerator file, use XLS file saved in step 2. 7. When prompted to open denominator file, use XLS file saved in step 4. 8. Comparison displays in grid; optionally save as Excel file. More About Analyses & Insights Questions that can be answered with this tool ... • what part of the Kansas City metro is comprised by the Missouri counties? • in total population? as a percent of metro? • how is this projected to trend 2010 through 2020? • what do these analyses suggest about trends by age cohort by county for metro? User Group Access Members of the ProximityOne User Group may install the Outlook2020 software and perform operations described in this section. Join the User Group now, there is no fee. See Outlook2020 installation notes Demographic-Economic Projections More about ProximityOne demographic-economic estimates and projections: • Outlook 2018 | Outlook 2030 | Outlook 2060 | Quarterly 3 year • integrated multi-sourced Situation & Outlook demographic-economic data Installation To install Outlook2020, run the Outlook2020 installer. Take all defaults. After installation, start Outlook2020 using the desktop icon. Terms of Use. Estimates and projections accessible via this Web page and in related files are proprietary to ProximityOne. The data may be used in any manner without further authorization except that the data may not be redistributed. There is no warranty or guarantee of any type. The user is solely responsible for any use. Support & DMI Web Sessions Learn more about using resources described in this section. Join us in a Decision-Making Information Web session. There is no fee for these one-hour Web sessions. Each informal session is focused on a specific topic. The open structure also provides for Q&A and discussion of application issues of interest to participants. We can address your specific questions about using metro and county demographic economic data and related applications. Additional Information ProximityOne develops geographic-demographic-economic data and analytical tools and helps organizations knit together and use diverse data in a decision-making and analytical framework. We develop custom demographic/economic estimates and projections, develop geographic and geocoded address files, and assist with impact and geospatial analyses. Wide-ranging organizations use our tools (software, data, methodologies) to analyze their own data integrated with other data. Follow ProximityOne on Twitter at www.twitter.com/proximityone. Contact ProximityOne (888-364-7656) with questions about data covered in this section or to discuss custom estimates, projections or analyses for your areas of interest. |
|
|