
|
|
Demographic Economic Characteristics of Largest Cities
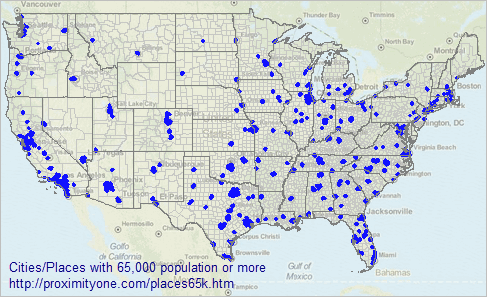
.. roughly one-third of the U.S. population (115 million) live in the approximate 580 cities/places with population 65,000 and over. A more current set of wide-ranging demographic-economic data are available for cities 65,000 population and over compared to smaller cities. This section provides data and data analytics tools to examine these demographic-economic characteristics for each/all of these cities. Use the interactive table below to view, rank compare, cities based on selected measures. Click a link in the table to view a detailed profile for any city. See the section below for information on more detailed data for each city and accessing similar data for each/all cities in the U.S. irrespective of size. The social and economic characteristics of these cities vary widely. Labor force attributes are included in the interactive table. A lagging economic indicator, the unemployment rate (percent of unemployed workers in the total labor force), provides some insight into how the economy is changing. Cities/Places 65,000 Population and Over The following graphic shows cities/places with 65,000 population or more with a blue fill pattern.  ... view developed using the CV XE GIS software. Drill-down Regional Map Views: • Dallas area • Houston area • Los Angeles - San Diego area Interactive Table Use the interactive table below to examine characteristics of individual cities in context of other cities. • Click link in "Code/Link" column 3 to view an extended demographic-economic profile. • See structure, content and usage notes below table. Demographic Economic Characteristics of Cities 65,000 Population or more -- Interactive Table Use mouse-over on header column to view extended item/column name. Click ShowAll button between Find/Queries. See usage notes below table. Related ranking tables: http://proximityone.com/rankingtables.htm. Usage Notes • -1 values indicate this item not available. • Click ShowAll button between queries • Click on a column header to sort on that column; click column header again to sort in other direction. • Click ShowAll button to show all tabulation areas and restore full set of data view. • Click State to select on geographies in a selected state. • Find in Name: Key in text/area name (partial okay) in text box to right of Find-in-Name button. .. then click Find-in-Name button to locate all matches in AreaName column (case sensitive). • 2013 Cols: Click this button to view only 2013 columns. • 2014 Cols: Click this button to view only 2014 columns. • 2010 Pop Min-Max: Key in minimum population in left text box, maximum population in right text box. .. then click 2010 Pop Min-Max button; table refreshes showing only cities within specified range. • Click ShowAll button between queries Column Descriptions - AreaName - St - Code Link - Type - Land Area SqMi - Water Area SqMi Census 2010 - Population 2010 - Housing Units 2010 American Community Survey 1 year estimates - Population 2013 - Population 2014 - Population Age 16+ 2013 - Population Age 16+ 2014 - Labor Force 2013 - Labor Force 2014 - Civ Labor Force 2013 - Civ Labor Force 2014 - Employed 2013 - Employed 2014 - Unemployed 2013 - Unemployed 2014 - Not in Labor Force 2013 - Not in Labor Force 2014 - Armed Forces 2013 - Armed Forces 2014 - Unemp Rate 2013 - Unemp Rate 2014 Using the Profiles and More Detailed Data Click a link in the above interactive table to view a demographic-economic profile for a selected city. The profile opens in a new page. An introductory section provides content, structural and usage information. Some cells show an "N" value indicating the item value is not available. Data for cells where values have been suppressed are typically available in the ACS 5-year estimates. The all U.S. cities/places ACS 2014 5-year estimates interactive tables are available using these links: • General Demographics • Social Characteristics • Economic Characteristics • Housing CHaracteristics Support Using these Resources Learn more about demographic economic data and related analytical tools. Join us in a Data Analytics Lab session. There is no fee for these Web sessions. Each informal session is focused on a specific topic. The open structure also provides for Q&A and discussion of application issues of interest to participants. ProximityOne User Group Join the ProximityOne User Group to keep up-to-date with new developments relating to geographic-demographic-economic decision-making information resources. Receive updates and access to tools and resources available only to members. Use this form to join the User Group. Additional Information ProximityOne develops geographic-demographic-economic data and analytical tools and helps organizations knit together and use diverse data in a decision-making and analytical framework. We develop custom demographic/economic estimates and projections, develop geographic and geocoded address files, and assist with impact and geospatial analyses. Wide-ranging organizations use our software, data and methodologies to analyze their own data integrated with other data. Follow ProximityOne on Twitter at www.twitter.com/proximityone. Contact ProximityOne (888-364-7656) with questions about data covered in this section or to discuss custom estimates, projections or analyses for your areas of interest. |
|
|