
|
|
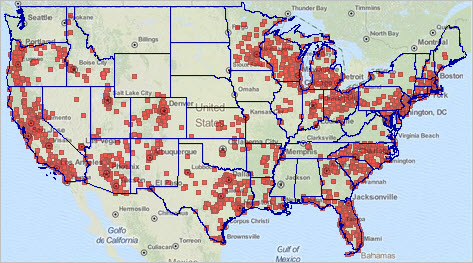
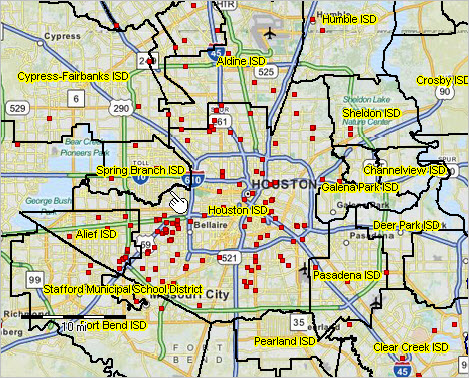
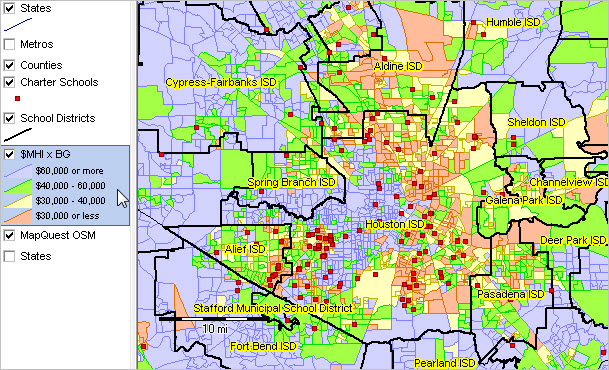
Charter schools are schools that provide free elementary and/or secondary education to eligible students under a specific charter granted by the state legislature or other authority. This section provides information on the approximate 7,000 charter schools identified by the U.S. Department of Education for the 2013-14 school year (details). Charter Schools, 2013-14 Using GIS tools, it is easy to see the geographic distribution of charter schools and how some counties/sub-state regions have concentrations. America's charter schools (red markers) as of the 2013-14 school year.  -- view developed using CV XE GIS; click graphic for larger view showing more detail. Charter Schools, 2013-14, Houston Region The following view illustrates a zoom-in view of the Houston, TX region. Charter schools (red markers) are shown in context of school districts (black boundary, yellow label. It is easy to see the relative few charter schools in Spring Branch ISD (see pointer) compared to Alief ISD and Houston ISD  -- view developed using CV XE GIS; click graphic for larger view showing more detail. Charter Schools, Houston Region & $MHI by Block Group  -- view developed using CV XE GIS; click graphic for larger view showing more detail. Additional Selected Views • Chicago, IL • Dallas, TX • Florida • Los Angeles, CA • Washington, DC • New York, NY Selected Characteristics All K-12 Schools • All K-12 schools with enrollment: 96,307 • Enrollment of all K-12 schools: 50,195,195 Charter Schools • Charter schools with enrollment: 6,375 • Enrollment of all charter schools: - Total population enrollment: 2,519,245 - Hispanic population (of any race) enrollment: 755,696 - Black, non-Hispanic population enrollment: 682,421 - White, non-Hispanic population enrollment: 878,375 • Enrollment of all charter schools having enrollment of 50 or more (5,986): 2,507,498 • Charter schools having 12th grade enrollment: 2,276 • Charter schools having 20 or more 12th grade enrollment: 1,648 • Charter schools with Free/Reduced Lunch Fee participation: 5,908 • Charter schools Title I Eligible (Public Law 103-382): 4,451 About the Data There were 6,934 schools in the 2013-14 K-12 schools dataset coded as charter school. Of these, 6,375 schools showed enrollment of one or more. For the remaining 559 schools, enrollment was reported as zero or not reported. ProximityOne User Group Join the ProximityOne User Group to keep up-to-date with new developments relating to metros and component geography decision-making information resources. Receive updates and access to tools and resources available only to members. Use this form to join the User Group. Support Using these Resources Learn more about accessing and using demographic-economic data and related analytical tools. Join us in a Data Analytics Lab session. There is no fee for these one-hour Web sessions. Each informal session is focused on a specific topic. The open structure also provides for Q&A and discussion of application issues of interest to participants. Additional Information ProximityOne develops geographic-demographic-economic data and analytical tools and helps organizations knit together and use diverse data in a decision-making and analytical framework. We develop custom demographic/economic estimates and projections, develop geographic and geocoded address files, and assist with impact and geospatial analyses. Wide-ranging organizations use our tools (software, data, methodologies) to analyze their own data integrated with other data. Follow ProximityOne on Twitter at www.twitter.com/proximityone. Contact ProximityOne (888-364-7656) with questions about data covered in this section or to discuss custom estimates, projections or analyses for your areas of interest. |
|
|