
|
|
CVXE GIS Tools Data Resources Guide - projections to 2060 Related Sections - Applications Gallery - States - Metros - School Districts - Congressional District - Counties - Cities/Places - Tracts/Neighborhoods - Block Groups - Census Blocks - ZIP Codes - Urban Areas Demographic-Economic Estimates-Projections GIS Thematic Mapping Visual Analysis Tools Ranking Tables National Scope Demographic Change 2000-2010 - States - Metros - Congressional District - School Districts - Counties - Cities/Places - Census Tracts |
.. examining U.S. by county demographic patterns Decision-making can be influenced by a thematic pattern map that conveys a strong message. Thematic pattern maps can often transcend spoken language and facilitate communication on an issue. The speed at which humans consume and interpret visual information is far faster than possible with tabular data presentation. Our ability to recall a visual message/graphic exceeds that of recalling tabular data. An important feature of GIS tools is the ability to modify the appearance of a thematic pattern view. A thematic pattern view is a rendering of the data by colors and patterns to reflect different data values. The flexibility to perform these operations is often not available in Web-based mapping tools. Desktop GIS tools offer more control over using the data and performing geospatial analyses. The ability to change the pattern appearance may be desired to show different colors/patterns representing data values and/or change a data value range corresponding to a color/pattern. This section builds on the U.S. by County & State Daytime Population GIS project (view that section) and illustrates steps that you can use to modify the appearance of the thematic pattern. The GIS project can be downloaded and used with GIS tools as described in that section. Visual Analysis of County Employment-Residence Ratio Patterns The following graphic shows patterns of the Employment-Residence (E-R) Ratio by county for the Atlanta area (Atlanta metro bold outline). See more about the E-R Raiot. 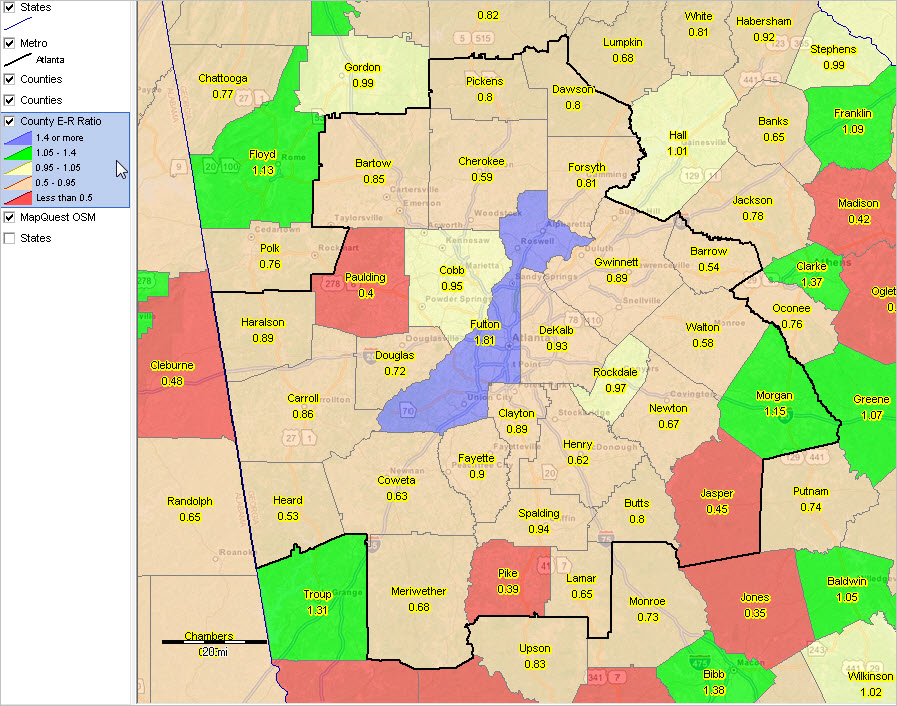 View created with CV XE GIS. Click graphic for larger view. Modifed Pattern View The next view shows patterns with a different range of values. See color pattern/data ranges in legend panel at left of map. Comparing the view below to the one above, the number of intervals has been reduced from five to three and interval values have been modified. We might want to make this change to have a view that shows more succinctly which counties have an E-R value greater than 1 versus less than 1. To account for counties that are close to the value of 1, a narrow mid-range section/interval is used. Is the view presented below "better" than the view shown above? The bold red and blue in the upper view are more dramatic. But the issue here is less on making the most impactful view and more on the mechanics of how to make changes to the pattern view. There are many factors that go into making the most impactful view, a topic for another time.  Using the Layer Editor to Modify the Layer Appearance/Pattern View After installing the CV XE software and the GIS project, the Daytime/E-R Ration project is opened. Next, the CV XE Layer Editor is used to change the appearance of the county E-R layer. To start the Layer Editor, double-click the name "County E-R Ratio" in the legend panel at the left of map (see in view above). The Layer Editor form appears as shown below. Using the Layer Editor, the first step is to modify the Section settings. Two intervals are removed and the range values settings are changed as shown below. 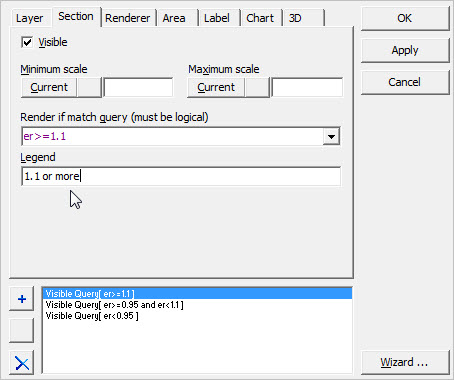 Next, while still in the Layer Editor, click the Area tab to modify colors. The new colors will be a muted blue, lighter yellow and orange (choose any). 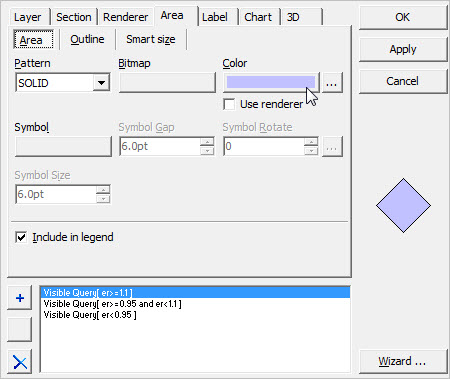 Next, in the new settings, the outlines (county polygon boundaries) are all set to black as shown below. The final step is to click the OK button and the modified view is shown. This action closes the Layer Editor form and the map view is refreshed. See Modified Pattern View shown above. If this view is not as expected, similar steps can be repeated. Exiting CV XE at this point will not save the setting for a project that is subsequently re-started. In this example, the project might be saved with the name (File>Save Project As) "c:\daytime2013\daytime_pop_2013new.gis". The view shown in the modified version above has been included in the project installer and is named "c:\daytime2013\daytime_pop_2013a.gis". Using the Modifed Pattern View Use the Pan/Drag tool on the toolbar to drag the map view to the Houston area as shown below. In this example, the Metro layer was modified. The CBSAFP (Core-Based Statistical Area FIPS code) value was modified to CBSAFP='26420' ... changing the code 12060 for the Atlanta metro to 26420 for the Houston metro A view can be created for any area .. one county, any region, a state or the U.S. 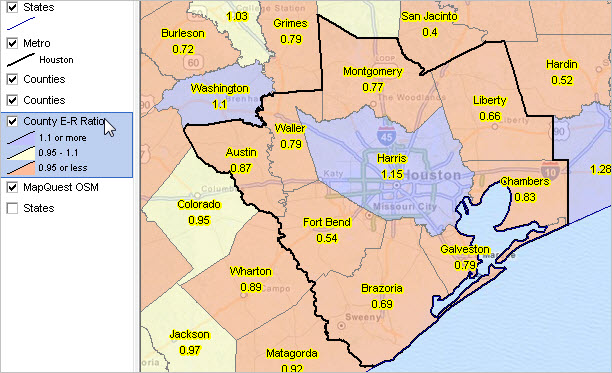 The same methods of modifying a view using the Layer Editor can be performed on any shapefile layer in any CV XE GIS project. A related section will illustrate how similar steps can be applied to develop a trend view of demographic change using this same project. Support Using these Resources Learn more about demographic economic data and related analytical tools. Join us in a Decision-Making Information Web session. There is no fee for these Web sessions. Each informal session is focused on a specific topic. The open structure also provides for Q&A and discussion of application issues of interest to participants. ProximityOne User Group Join the ProximityOne User Group to keep up-to-date with new developments relating to geographic-demographic-economic decision-making information resources. Receive updates and access to tools and resources available only to members. Use this form to join the User Group. There is no fee. Additional Information ProximityOne develops geographic-demographic-economic data and analytical tools and helps organizations knit together and use diverse data in a decision-making and analytical framework. We develop custom demographic/economic estimates and projections, develop geographic and geocoded address files, and assist with impact and geospatial analyses. Wide-ranging organizations use our software, data and methodologies to analyze their own data integrated with other data. Follow ProximityOne on Twitter at www.twitter.com/proximityone. Contact ProximityOne (888-364-7656) with questions about data covered in this section or to discuss custom estimates, projections or analyses for your areas of interest. |
|
|