
|
|
|
-- annually updated demographic-economic data to the block group level Essential data to assess where we are, how things have changed and how things might change in the future down to the sub-neighborhood level. The American Community Survey (ACS) is a nationwide survey designed to provide annually updated demographic-economic data for national and sub-national geography. ACS provides a wide range of important data about people and housing for every community across the nation. The results are used by everyone from planners to retailers to homebuilders and issue stakeholders like you. ACS is a primary source of local data for most of the 40 topics it covers, such as income, education, occupation, language and housing. ProximityOne uses ACS data to develop current estimates on these topics and 5-year projections. Use the Demographic Economic Data Explorer (DEDE) with ACS 2025. Access the most detailed subject matter for the smallest geography. Join the Weekly Web Sessions. Learn more about key topics. No cost. See topics and connectivity details; Tuesday, Wednesday and Thursday at 3:00 pm ET. Topics in this Section ACS 2025 Data Access & Use .. goto top • Web Sessions - accessing, integrating, analyzing these data with other data • Demographic Economic Data Explorer (DEDE) - create your own GIS friendly datasets • VDAGIS Suite - map and geospatially analyze these data in context of other geography & subject matter • Interactive Tables - evolving, topic oriented interactive tables Some Data Delayed Release -- Revisions The release dates for the ACS 2025: • 1-year (areas over 65,000) and 1-year supplemental estimates (areas over 20,000) scheduled for October 29, 2026. • 1-year PUMS data have an unknown release date. • 5-year Public Use Microdata Sample (PUMS) files have an unknown release date. • 5-year estimates nave an unknown release date. • 5-year Public Use Microdata Sample (PUMS) files have an unknown release date. ACS 2025 Data Resource Summary .. goto top • 2025 ACS 1-year estimates .. now scheduled October 29, 2026 .. estimates for areas 65,000 population and over • 2025 ACS 1-year supplemental estimates .. now scheduled October 29, 2026 .. estimates for areas 20,000 population and over • 2025 ACS 5-year estimates "ACS 2021-2025 5-year period" have an unknown release date .. estimates for all areas down to block group level • 2025 ACS 1-year PUMS data .. have an unknown release date .. microdata data for custom estimates and individual modeling • 2025 ACS 5-year PUMS data "ACS 2021-2025 5-year period" .. have an unknown release date6 .. microdata data for custom estimates and individual modeling • 2025 ACS 5-year School District Special Tabulation .. have an unknown release date ACS 2025 Data Profiles - Table Shells XLS files .. goto top • DP02 - Social Characteristics 154 items • DP03 - Economic Characteristics 137 items • DP04 - Housing Characteristics 143 items • DP05 - General Demographics 108 items • 2025 Itemset1 243 items ACS Areas Published by Year .. goto top • Areas published by year • Vintages of legal and statistical boundaries tabluated by ACS tabulation year 2009 forward. • For example, find out that 2020 PUMAs were first used as an ACS tabulation area in ACS 2021. 118th Congressional Districts: ACS 2022 & ACS 2023 Demographic Change Interactive table goto top This table will be updated in November 2026. 120th Congressional Districts: Census 2020 & ACS 2025 Demographic Change Data are from the American Community Survey (ACS) 1-year estimates. Click column header to sort; again to sort other direction. Click ShowAll/Reset button between queries to refresh table. Usage notes below table. Interactive Table Usage Notes Operations • Click ShowAll between queries/filters. Items in Table - 118th Congressional District - State - StCD - Population 2022 - Population 2023 - Population 22-23 Change - Population 22-23 %Chg - Employment 2022 - Employment 2023 - Employment 22-23 Change - Employment 22-23 %Chg - Unemployment Rate 2022 - Unemployment Rate 2023 - Unemployment Rate 22-23 Chg - Unemployment Rate 22-23 %Chg • VDAGIS Map Illustrating Patterns of ACS 2023 1 year Unemployment Rate by Congressional District 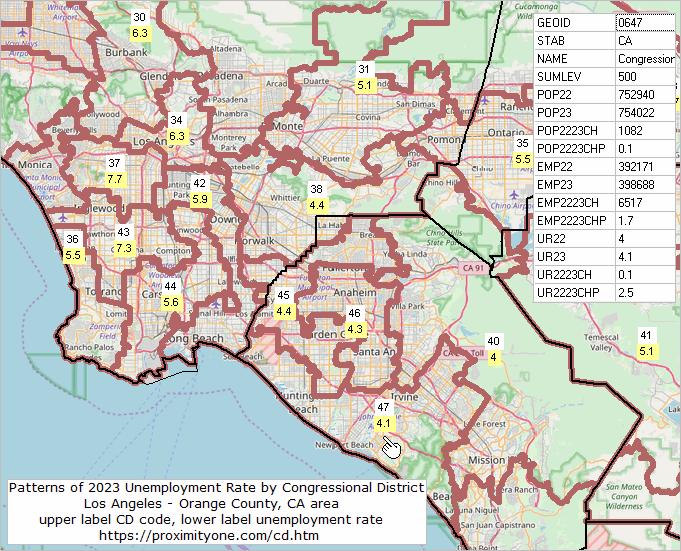 Using ACS Data; ACS 1-Year versus ACS 5-Year Data .. goto top While ACS 1-year estimates are suitable for time-series analyses, the ACS 5-year estimates are not the same as annual demographic-economic estimates and may not be suitable for annual time series analyses. Advantages of using the 5-year estimates • the data are available for all census tracts and ZIP code areas. • the data are available for all cities/places, counties and school districts irrespective of size. Disadvantages of using the 5-year estimates • the data are older than the 1-year estimates. • the data are for a 5-year period rather than one year. • additional cautions in comparing estimates over time (see below). Advantages of using the 1-year estimates • the data are more recent than the 5-year estimates. • the data are generally more accurate than the 5-year estimates. Disadvantages of using the 1-year estimates • the data are not available for block groups, census tracts and ZIP code areas. • the data are available for only areas of 65,000 population and over. Areas Published .. goto top ... availability of summary statistic data by type of geography
Notes ... 1 County equivalents include Alaska boroughs, municipalities, city and boroughs, and census areas; the District of Columbia; Louisiana parishes; Puerto Rico municipios; independent cities in Maryland, Missouri, Nevada, and Virginia. 2 For 1-year estimates, qualifying Minor Civil Divisions in 20 states only. For 5-year estimates, all county subdivisions. 3 1-year estimates are not produced for this geographic level, regardless of population size. 4 All metropolitan statistical areas receive ACS 1-year estimates. A population minimum of 50,000 is applied instead of the standard 65,000. 5 Legislative session year 2024. * Counts based on geographic area boundaries as of January 1, 2025. ** ACS data are not published for blocks. ProximityOne User Group .. goto top Join the ProximityOne User Group to keep up-to-date with new developments relating to metros and component geography decision-making information resources. Receive updates and access to tools and resources available only to members. Use this form to join the User Group. Support Using these Resources Learn more about accessing and using demographic-economic data and related analytical tools. Join us in a Web session. There is no fee for these one-hour Web sessions. Each informal session is focused on a specific topic. The open structure also provides for Q&A and discussion of application issues of interest to participants. Additional Information ProximityOne develops geodemographic-economic data and analytical tools and helps organizations knit together and use diverse data in a decision-making and analytical framework. We develop custom demographic/economic estimates and projections, develop geographic and geocoded address files, and assist with impact and geospatial analyses. Wide-ranging organizations use our tools (software, data, methodologies) to analyze their own data integrated with other data. Contact us (888-364-7656) with questions about data covered in this section or to discuss custom estimates, projections or analyses for your areas of interest. | ||||||||||||||||||||||||||||||||||||||||||||||||||||||||||||||||||||||||||||||||||||||||||||||||||||||||||||||||||||||||||||||||||||||||||||||||||||||||||||||||||||||||||||||||||||||||||||||||||||||||||||
|
|
