|
|
|
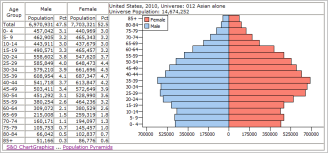
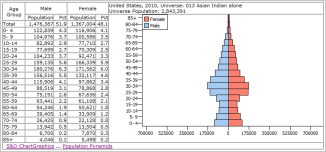
As the U.S. total population increased from Census 2000 281.4 million to Census 2010 308.7 million (9.7 percent), the Asian population increased from 10.2 million to 14.7 million (43.3 percent). Of the Asian population, the Asian Indian population (see race categories) increased from 1.7 million to 2.8 million (69.4 percent). Major sub-groups of the Asian population (Asian Indian, Chinese, Filipino, Japanese, Korean and Vietnamese) are shown in a table presented below. The Asian population is distributed unevenly throughout the U.S. As of Census 2010, and among Metropolitan Statistical Areas (MSAs), the Asian Indian population ranged from a high of 6.6 percent of the total population in the Yuba City, CA MSA to just 44 persons in Farmington, NM MSA. The highest number of Asian Indians is in the New York MSA (526,133). Examine Asian population distribution by type and metro using the interactive table below. More about Asian race groups - below in this section. Patterns of the Asian Indian Population by Census Tract Asian population estimates by race subcategory are updated annually in the American Community Survey (ACS). The following view shows patterns of the Asian Indian population by census tract in the Chicago metro (bold boundary) area based on the ACS 2017 5-year estimates (ACS2017).  - view developed using ProximityOne CV XE GIS software. Asian Population by ZIP Code & Urban/Rural Status Patterns of percent Asian population by ZIP Code in Houston, TX area. Create pattern views like this for any area (request info). Showing ZIP code sreas having certain percentages of population who are Asian. Orange fill pattern shows urban areas (defined by census block). Areas with no orange fill pattern are rural blocks 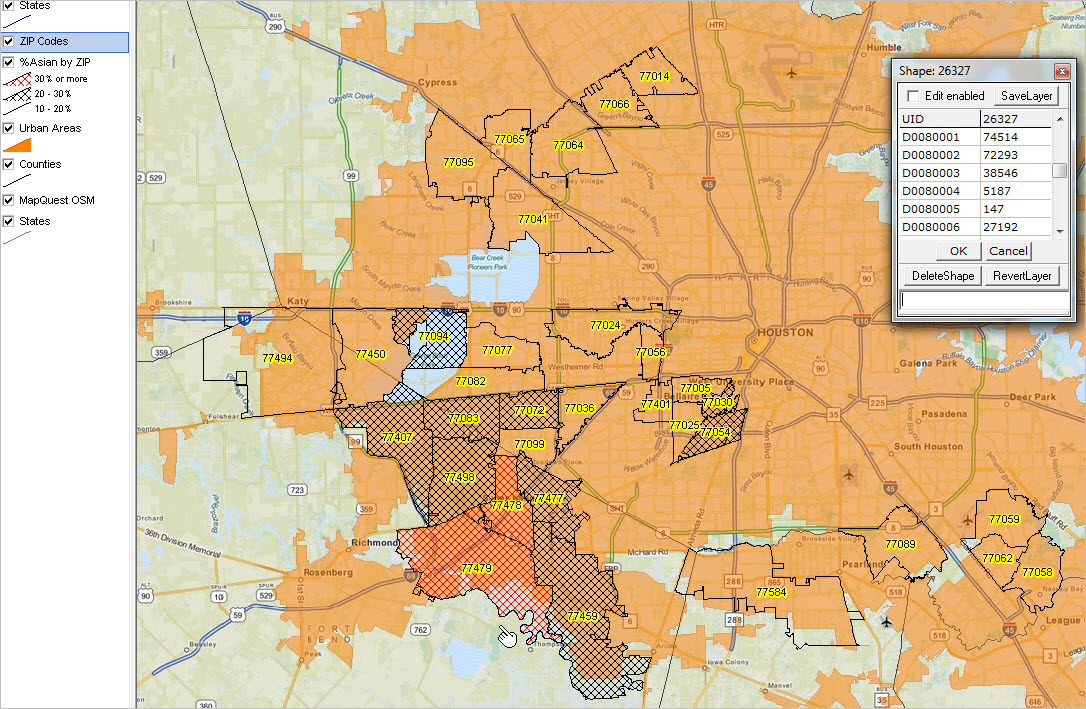 ZIP code areas in view with highest percent Asian population (see pointer) are shown with red crosshatch pattern. • Click graphic for larger view, zoom-in & ZIP Codes as labels. • Click this link to view zoom-in, isolating ZIPs with 30% or more Asian. See similar pattern maps for other cities/regions. Analyzing Asian Demographic Characteristics & Patterns • Census 2010 provides important insights but additional data and tools are needed ... • view Asian long-term trends, integrated multi-sourced data for any county using CV XE APIGateway • use Outlook Estimates & Projections to examine Asian patterns trending into the future • develop custom Asian demographic estimates using CV XE Crosstabs & PUMS • maps -- visually analyze multi-cultural demographics down to intersection level using CV XE GIS Selected Topics & Updates ... scroll section
Several items in this section ...
1. Examining Linguistic Isolation by Block Group • Asian & Pacific Islander languages spoken at home ACS 2010/11 block group demographics • interactive ranking table and GIS visual analysis; http://proximityone.com/language_spoken.htm 2. Interactive Tables to Examine Asian Population in Context of Other Demographics • http://proximityone.com/rankingtables.htm 3. 2011 Demographic Updates -- tables (xls) from Annual Social and Economic Supplement to Current Population Survey
Table 1. Population by Sex and Age, for Asian Alone and White Alone, Not Hispanic: 2011 Table 2. Marital Status of the Population 15 Years and Over by Sex, for Asian Alone and White Alone, Not Hispanic: 2011 Table 3. Educational Attainment of the Population 25 Years and Over by Sex, for Asian Alone and White Alone, Not Hispanic: 2011 Table 4. Nativity and Citizenship Status by Sex, for Asian Alone and White Alone, Not Hispanic: 2011 Table 5. Year of Entry of the Foreign-Born Population by Sex, for Asian Alone and White Alone, Not Hispanic: 2011 Table 6. Households by Type, for Asian Alone and White Alone, Not Hispanic Households: 2011 Table 7. Households by Type and Size, for Asian Alone and White Alone, Not Hispanic Households: 2011 Table 8. Labor Force and Employment Status of the Civilian Population 16 Years and Over by Sex, for Asian Alone and White Alone, Not Hispanic: 2011 Table 9. Occupation of the Civilian Employed Population 16 Years and Over by Sex, for Asian Alone and White Alone, Not Hispanic: 2011 Table 10. Earnings of Full-Time, Year-Round Workers 15 Years and Over by Sex, for Asian Alone and White Alone, Not Hispanic: 2010 Table 11. Earnings of Full-Time, Year-Round Workers 15 Years and Over by Sex, for Asian Alone and White Alone, Not Hispanic: 2010 [XLS - 36K] [CSV - 4K] Table 12. Total Money Income of Households by Type, for Asian Alone and White Alone, Not Hispanic Households: 2010 Table 13. Poverty Status of the Population by Sex and Age, for Asian Alone and White Alone, Not Hispanic: 2010 Table 14. Housing Tenure by Household Type, for Asian Alone and White Alone, Not Hispanic Households: 2011 Table 15. Housing Tenure by Family Type, for Asian Alone and White Alone, Not Hispanic Families: 2011 Table 16. Regional Distribution of the Population by Sex, for Asian Alone and White Alone, Not Hispanic : 2011 Table 17. Race and Hispanic Origin Distribution of the Population by Sex and Region: 2011 Table 18. Generational Distribution of the Population by Sex, for Asian Alone and White Alone, Not Hispanic: 2011 Table 19. Race and Hispanic Origin Distribution of the Population by Sex and Generation: 2011 Table 20. Mobility Status of the Population One Year and Older by Sex, for Asian Alone and White Alone, Not Hispanic: 2010-2011 Table 21. Health Insurance Status by Sex and Age, for Asian Alone and White Alone, Not Hispanic: 2011 4. Census 2010 Summary File 2 Use the Census 2010 Summary File 2 (http://proximityone.com/cen2010_sf2.htm) interactive ranking table to explore/analyze the Demographic Profile 1 subject matter for the U.S. by state and county for selected race groups. Race groups include Asian alone, Asian Indian alone, Chinese alone, Japanese alone, Native Hawaiian and Other Pacific Islander alone, Native Hawaiian alone Native Hawaiian alone and in combination with one or more other races, among others. Examine what population pyramids can tell us about specific race group populations by area. Population by 5-year age group on Y-axis with male (blue, left) and female (light red, right) on x-axis.
Asian Population Patterns by Metro: Census 2010 -- Interactive Table Click column header to sort; click again to sort other direction. Click ShowAll button between State or Metro type queries. Horizontal scroll right to view additional columns. See related Ranking Tables Main Page. Usage notes ... • Click ShowAll button. • Use dropdown to select state. • Use dropdown to select summary level. • Rank on a selected column by clicking header on that column. • Rank in other direction by clicking same header again. America's Changing Race Patterns: Census 2000 to Census 2010 ... use interactive ranking table below this table to examine patterns of the Asian population by metropolitan area.
Census 2010 Questionnaire and Asian Population ... scroll section The Census 2010 questionnaire collected data about Asian population in the race question. Respondents were asked to mark checkboxes that apply.
Census 2010 Asian Race Groups For Census 2010, there are 24 Asian alone race groups. There are an additional 25 Asian race groups for Asian alone or in combination with other races. The total set of 49 Asian race groups codes are listed below. National scope Census 2010 summary data (tables) are available for each of these race categories for census tract and higher level geography from Census 2010 Summary File 2 (SF2). Asian Race Groups (scroll box)
012 Asian alone (400-499)
013 Asian Indian alone (400-401) 014 Bangladeshi alone (402) 072 Bhutanese alone (403) 073 Burmese alone (404) 015 Cambodian alone (405-409) 016 Chinese alone (410-419) 017 Chinese (except Taiwanese) alone (410-411) 018 Taiwanese alone (412-419) 019 Filipino alone (420-421) 020 Hmong alone (422) 021 Indonesian alone (423-429) 022 Japanese alone (430-439) 023 Korean alone (440-441) 024 Laotian alone (442) 025 Malaysian alone (443) 075 Mongolian alone (465) 076 Nepalese alone (472) 077 Okinawan alone (444) 026 Pakistani alone (445) 078 Singaporean alone (473) 027 Sri Lankan alone (446) 028 Thai alone (447-449) 029 Vietnamese alone (450-459) 031 Asian alone or in combination with one or more other races (400-499) & (100-299) or (300, A01-Z99) or (400-999) 032 Asian Indian alone or in any combination (400-401) & (100-299) or (300, A01-Z99) or (400-999) 033 Bangladeshi alone or in any combination (402) & (100-299) or (300, A01-Z99) or (400-999) 080 Bhutanese alone or in any combination (403) & (100-299) or (300, A01-Z99) or (400-999) 081 Burmese alone or in any combination (404) & (100-299) or (300, A01-Z99) or (400-999) 034 Cambodian alone or in any combination (405-409) & (100-299) or (300, A01-Z99) or (400-999) 035 Chinese alone or in any combination (410-419) & (100-299) or (300, A01-Z99) or (400-999) 036 Chinese (except Taiwanese) alone or in any combination (410-411) & (100-299) or (300, A01-Z99) or (400-999) 037 Taiwanese alone or in any combination (412-419) & (100-299) or (300, A01-Z99) or (400-999) 038 Filipino alone or in any combination (420-421) & (100-299) or (300, A01-Z99) or (400-999) 039 Hmong alone or in any combination (422) & (100-299) or (300, A01-Z99) or (400-999) 040 Indonesian alone or in any combination (423-429) & (100-299) or (300, A01-Z99) or (400-999) 041 Japanese alone or in any combination (430-439) & (100-299) or (300, A01-Z99) or (400-999) 042 Korean alone or in any combination (440-441) & (100-299) or (300, A01-Z99) or (400-999) 043 Laotian alone or in any combination (442) & (100-299) or (300, A01-Z99) or (400-999) 044 Malaysian alone or in any combination (443) & (100-299) or (300, A01-Z99) or (400-999) 082 Maldivian alone or in any combination (471) & (100-299) or (300, A01-Z99) or (400-999) 083 Mongolian alone or in any combination (465) & (100-299) or (300, A01-Z99) or (400-999) 084 Nepalese alone or in any combination (472) & (100-299) or (300, A01-Z99) or (400-999) 085 Okinawan alone or in any combination (444) & (100-299) or (300, A01-Z99) or (400-999) 045 Pakistani alone or in any combination (445) & (100-299) or (300, A01-Z99) or (400-999) 086 Singaporean alone or in any combination (473) & (100-299) or (300, A01-Z99) or (400-999) 046 Sri Lankan alone or in any combination (446) & (100-299) or (300, A01-Z99) or (400-999) 047 Thai alone or in any combination (447-449) & (100-299) or (300, A01-Z99) or (400-999) 048 Vietnamese alone or in any combination (450-459) & (100-299) or (300, A01-Z99) or (400-999) Support Using these Resources Learn more about demographic economic data and related analytical tools. Join us in a Data Analytics Lab session. There is no fee for these Web sessions. Each informal session is focused on a specific topic. The open structure also provides for Q&A and discussion of application issues of interest to participants. ProximityOne User Group Join the ProximityOne User Group to keep up-to-date with new developments relating to geographic-demographic-economic decision-making information resources. Receive updates and access to tools and resources available only to members. Use this form to join the User Group. Additional Information ProximityOne develops geographic-demographic-economic data and analytical tools and helps organizations knit together and use diverse data in a decision-making and analytical framework. We develop custom demographic/economic estimates and projections, develop geographic and geocoded address files, and assist with impact and geospatial analyses. Wide-ranging organizations use our software, data and methodologies to analyze their own data integrated with other data. Follow ProximityOne on Twitter at www.twitter.com/proximityone. Contact ProximityOne (888-364-7656) with questions about data covered in this section or to discuss custom estimates, projections or analyses for your areas of interest. | ||||||||||||||||||||||||||||||||||||||||||||||||||||||||||||||||||||||||||||||||||||||||||||||||||||||||||||||||||||||||||||||||||||||||||||||||||||||||||||||||||||||||||||||||
|
|