
|
|
|
-- using census block & block group demographics Demographic characteristics of the Chelsea area in New York City, an area west of Avenue of the Americas between 14th and 34th Streets, is radically different from adjacent areas. This topic was covered in a "great wealth divide" New York Times story. This section reviews how census block and block group demographic-economic data can be used to examine these patterns. A GIS project is used that associates census block and block group data for visual analysis Methods summarized here can be applied to any area. Use the tools described in this section to obtain demographic-economic profiles for any neighborhood based on an address. Study Area in Context of Broader Area The study area, a group of selected census tracts, is shown as the red cross-hatched area in context of lower Manhattan in the view below. 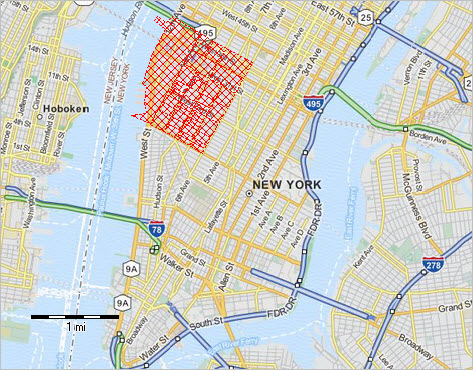 -- view created using CV XE GIS and associated GIS Project Zoom-in View of Study Area The next view shows a zoom-in to the study area. Block groups are shown with a red boundary. Chelsea Park is visible as the green area above the pointer south of 29th street. 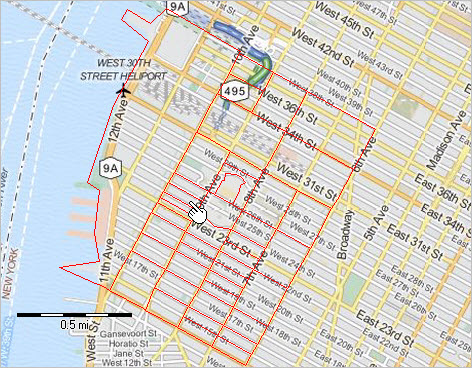 -- view created using CV XE GIS and associated GIS Project Census Block Demographics in Context of Block Groups The next view shows a further zoom-in showing census blocks with black boundary and block groups with red boundary. Census blocka are shown with a semi-transparent yellow fill pattern (population greater than 4) and gray fill pattern (blocks with population less than 5). The block group containing Chelsea Park (green area above pointer) contains three census blocks, 2 with no population and one with 1,010 population. Block data are from Census 2010; there are no post-Census 2010 block level demographics available. The analysis could be extended to shown wide-ranging demographics at the block level. 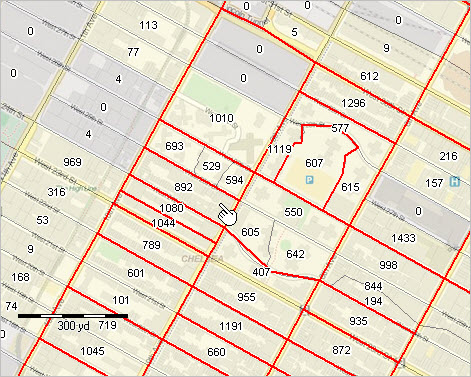 -- view created using CV XE GIS and associated GIS Project Examining Socioeconomic Attributes In this further zoom-in, Chelsea Park (green area) is shown near the pointer. Census block population labels are turned off for blocks with 5 or more population to help show a less cluttered view. Block groups are labeled with two values. The yellow upper label shows the median housing value (MHV). The green lower label shows median household income (MHI). Both data items are based on the American Community Survey 5-year estimates (ACS 2013) are centric to 2011. The ACS data are updated annually; as of October 2015, the latest data are from ACS 2013; the ACS 2014 data become available December 2015. The ACS 2013 5 year estimates are top-coded at $1,000,001 for MHV and $250,001 for $MHI. 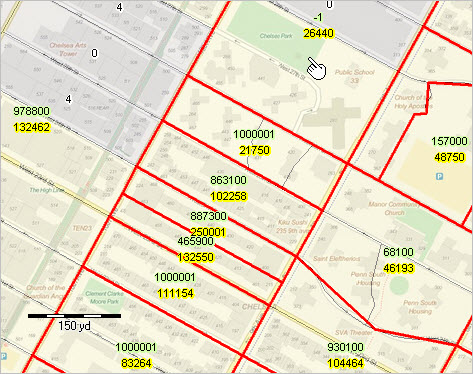 -- view created using CV XE GIS and associated GIS Project The block group containing Chelsea Park has a median household income of $26,440; the median housing value estimate is not available (too few owner-occupied units to develop MHV estimate). The Chelsea Park block group code is "360610097002" -- this code uniquely identifies this block group among all other block groups in the U.S. The block group immediately to the south of the Chelsea Park block group median household income of $21,750; the median housing value estimate is $1,000,001 (top-coded). The code for this block group code is "360610093006". While the MHI for BG 360610093006 might seem like it should be higher, a look at the number of households by income interval explains this number. Almost half of the households in the BG have a household income below $20,000. Analytical options that might be considered include using mean household income or mean family income instead of median. Compare number of households by household income intervals for these two block groups. Compare Your Block Group of Interest to Chelsea Park BG Compare the above BG attributes to any BG of interest: 1. Copy and paste this string into text editor (eg, Notepad) window (do not press enter after paste): http://factfinder.census.gov/bkmk/table/1.0/en/ACS/13_5YR/B19001/1500000USXXXXXXXXXXX|1500000US360610097002 2. Click here, key in an address then click Find to locate the 11 character BG code. -- scroll down to "2010 Census Blocks" and then further to "GEOID" -- copy the first 11 digits of the GEOID value to clipboard see illustrative graphic. 3. Paste those 11 characters into the URL, replacing the "XXXXXXXXXXXX"; this modification must be exact. 4. Press Enter. A profile appears comparing your BG to the Chelsea Park BG 360610097002. Support Using these Resources Learn more about demographic economic data and related analytical tools. Join us in a Data Analytics Lab session. There is no fee for these Web sessions. Each informal session is focused on a specific topic. The open structure also provides for Q&A and discussion of application issues of interest to participants. ProximityOne User Group Join the ProximityOne User Group to keep up-to-date with new developments relating to geographic-demographic-economic decision-making information resources. Receive updates and access to tools and resources available only to members. Use this form to join the User Group. Additional Information ProximityOne develops geographic-demographic-economic data and analytical tools and helps organizations knit together and use diverse data in a decision-making and analytical framework. We develop custom demographic/economic estimates and projections, develop geographic and geocoded address files, and assist with impact and geospatial analyses. Wide-ranging organizations use our software, data and methodologies to analyze their own data integrated with other data. Follow ProximityOne on Twitter at www.twitter.com/proximityone. Contact ProximityOne (888-364-7656) with questions about data covered in this section or to discuss custom estimates, projections or analyses for your areas of interest. |
|
|