
|
|
|
Children in Poverty by School District 2013
This section provides interactive access to 2013 school district estimates of the total population, number of grade relevant children ages 5 to 17, and number of grade relevant related children ages 5 to 17 in families in poverty. These data are based on Census Bureau estimates developed annually under sponsorship of the U.S. Department of Education. These data are used as an input to the allocation formula for Title I of the Elementary and Secondary Education Act. The Title I program distributes funding to school districts based on the number and percentage of low-income children. The U.S. Department of Education will use these 2013 estimates to allocate fiscal year 2015 funds for Title I and other programs to states and school districts for use primarily in the 2015-16 school year. Percent Children in Poverty by School District, 2013 The following graphic shows the grade relevant children in poverty as a percent of total grade relevant children by school district. 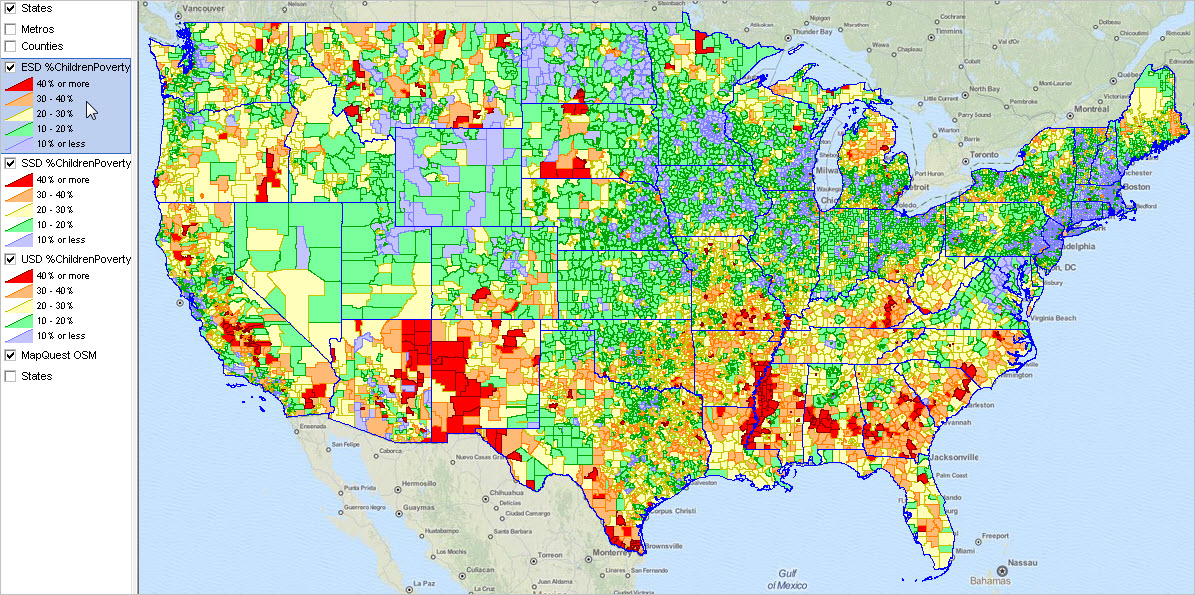 View developed with CV XE GIS software. Click graphic for larger view. The above view shows all school districts (elementary, secondary and unified). In states such as California and Illinois, where two school districts may cover an intersecting area (e.g, an elementary and a secondary) some poverty incidence might be masked. The larger view shows that districts are shown as three layers (ESD, SSD, USD) -- each layer uses the same shapefile with a query placed on type of district selected. With all three layers checked, ESDs are shown above SSDs and above USDs. See these additional views (districts labeled with percent children in poverty): • Houston Metro; unified districts layer only • Arizona & southwest region; unified districts layer only • Arizona & southwest region; all district types • Phoenix, AZ Area Elementary School Districts • New York state and region school districts • Albany, NY area school districts Examining Children's Demographics & School/School District Characteristics Join us in the K-12 schools & school districts focused one hour no fee Web session. Accessing, integrating and using multi-sourced data for children's living characteristics and schools/school districts. Children in Poverty by School District, 2013 -- interactive table Click ShowAll between queries/filters. Click column header to sort; again to sort other direction. See usage notes below table. See related Ranking Tables Main Page Usage Notes • Click ShowAll between queries/filters. About these Data These data are model-based estimates as of 2013. These data are consistent with the American Community Survey 2013 1-year estimates (ACS 2013) but are different from the ACS data. Terminology and additional details follow. Related children ages 5 to 17 in families are those children who are related to householder by birth, marriage, or adoption. Foster children are not included in families. School-age population, children ages 5 to 17, are those children who live within the school district boundary and who are in an appropriate grade range. It is not a measure of school district enrollment. School districts as defined as of January 1, 2014, and are based on school district boundaries for the 2013-2014 school year. The 2013 estimates are consistent with the population controls and income concepts used in the 2013 American Community Survey (ACS2013) single-year estimates. Shapefiles & Subject Matter Data School District Shapefile - sd2014.dbf -- dbase file - sd2014.shp -- geometry (lat-lon of vertices) - sd2014.shx -- index -- associating geometry for an object (school district) to dbf data record - sd2014.prj -- projection file Subject Matter Data - ussd13a.dbf Joining/integrating sd2014.dbf and ussd13a.dbf based on common key values - move ussd13a.dbf item(s) into sd2014.dbf (sd2014 sequence must be preserved due to .shx index order) - in this case unique school district ID -- stateFIPS [2] + Federal district code [5] Related Data • 2013-14 School District Boundary Files (shapefiles) • ACS 2012 School District Demographic-Economic interactive tables General Demographics .. Social Characteristics .. Economic Characteristics .. Housing Characteristics • ACS 2012 Children's Demographics by School District - school district profiles Support Using these Resources Learn more about demographic economic data and related analytical tools. Join us in a Decision-Making Information Web session. There is no fee for these one-hour Web sessions. Each informal session is focused on a specific topic. The open structure also provides for Q&A and discussion of application issues of interest to participants. ProximityOne User Group Join the ProximityOne User Group to keep up-to-date with new developments relating to geographic-demographic-economic decision-making information resources. Receive updates and access to tools and resources available only to members. Use this form to join the User Group. There is no fee. Additional Information ProximityOne develops geographic-demographic-economic data and analytical tools and helps organizations knit together and use diverse data in a decision-making and analytical framework. We develop custom demographic/economic estimates and projections, develop geographic and geocoded address files, and assist with impact and geospatial analyses. Wide-ranging organizations use our tools (software, data, methodologies) to analyze their own data integrated with other data. Follow ProximityOne on Twitter at www.twitter.com/proximityone. Contact ProximityOne (888-364-7656) with questions about data covered in this section or to discuss custom estimates, projections or analyses for your areas of interest. |
|
|