
|
|
|
Analyzing County Diversity 1960 2060 -- USA TODAY analyses using ProximityOne projections to 2060
The USA TODAY Diversity Index shows diversity has surged in the last 50 years and is expected to continue rising. The U.S. index rose from 20 in 1960 to 55 in 2010. Driven by changing attitudes and a record wave of immigration, the pace of change varies widely, sometimes even in adjacent counties. The diversity index measures the degree of racial and ethnic diversity of the population. The percentage of each race (White, Black, American Indian/Alaska Native, Asian, Native Hawaiian) and Hispanic origin/ethnicity are used to calculate the chance that any two people are from different groups. The index ranges from 0 (no diversity) to 100 (highest diversity). From USA TODAY main story ... "USA TODAY used Census data to calculate the chance that two random people are different by race or ethnicity and came up with a Diversity Index to place every county on a scale of 0 to 100. The nationwide USA TODAY Diversity Index hit 55 in 2010, up sharply from 20 in 1960 and 40 as recently as 1990. In South Orange, the index is 59. This is just the beginning. Barring catastrophe or a door-slam on immigration, the Diversity Index is on track to top 70 by 2060, according to a USA TODAY analysis of population projections by ProximityOne of Alexandria, Va. That means there will be less than a 1-in-3 chance that the next person you meet will share your race or ethnicity, whatever it is: white, black, American Indian, Asian, Native Hawaiian or Hispanic. As people from varying cultures and races come together or collide, local governments and other institutions deal with a host of new issues, from conflicts over spending and diverse hiring to violence in the streets and language barriers." Diversity Patterns in Your County Key in your county name and then pick from list. Scroll down to view entire infographic. USA TODAY Analyses of ProximityOne Projections to 2060 • Main story -- Second immigration wave lifts diversity to record high • Interactive mapping: Mapping the USA's Diversity: 1960-2060 • About ProximityOne projections used in the USA TODAY analyses ProximityOne Neighborhood Diversity Analyses Mapping Diversity Patterns  Click graphic for larger view. Credits: Paul Overberg, USA TODAY Amanda Astey, Sarah Frostenson, Anthony DeBarros, Gannett Digital Source: USA TODAY analysis of data from Census Bureau; NHGIS, University of Minnesota; ProximityOne, Alexandria, VA Viewing National Diversity Patterns by Race/Origin Charts 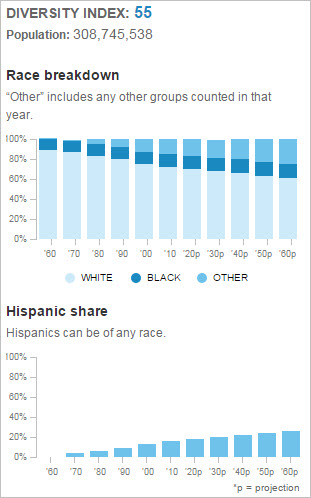 Click graphic for larger view. Credits: Paul Overberg, USA TODAY Amanda Astey, Sarah Frostenson, Anthony DeBarros, Gannett Digital Source: USA TODAY analysis of data from Census Bureau; NHGIS, University of Minnesota; ProximityOne, Alexandria, VA Viewing Change by State: 1960 - 2010 - 2060 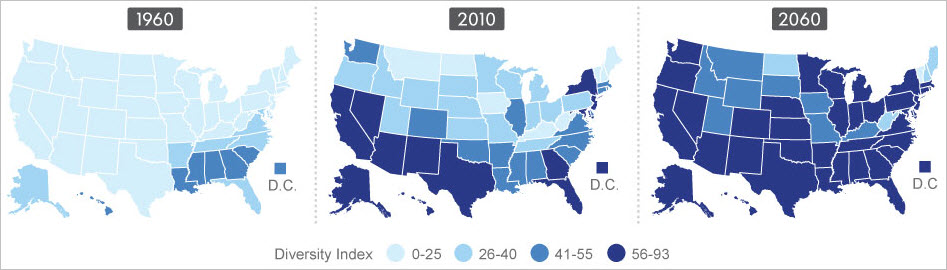 Click graphic for larger view. Source: USA TODAY analysis of data from Census Bureau; NHGIS, University of Minnesota; ProximityOne, Alexandria, VA Get the Diversity Profile for Your County Scroll down to the interactive section shown below, illustrating the chart and data for Maricopa County, AZ and Arizona. Key in a county name of interest to view the chart and data for that location. Maricopa County, AZ Diversity Patterns 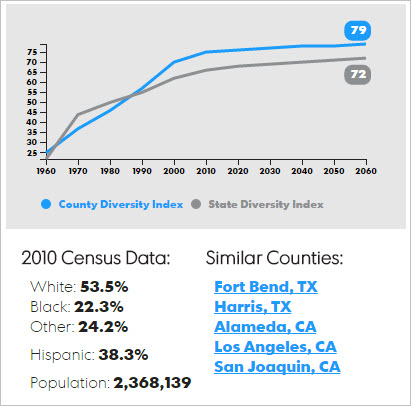 Click graphic for larger view. Credits: Tory Hargo, Paul Overberg, Mitchell Thorson, USA TODAY Source: USA TODAY analysis of data from Census Bureau; NHGIS, University of Minnesota; ProximityOne, Alexandria, VA Support Using these Resources Learn more about demographic economic data and related analytical tools. Join us in a Data Analytics Lab session. There is no fee for these Web sessions. Each informal session is focused on a specific topic. The open structure also provides for Q&A and discussion of application issues of interest to participants. ProximityOne User Group Join the ProximityOne User Group to keep up-to-date with new developments relating to geographic-demographic-economic decision-making information resources. Receive updates and access to tools and resources available only to members. Use this form to join the User Group. Additional Information ProximityOne develops geographic-demographic-economic data and analytical tools and helps organizations knit together and use diverse data in a decision-making and analytical framework. We develop custom demographic/economic estimates and projections, develop geographic and geocoded address files, and assist with impact and geospatial analyses. Wide-ranging organizations use our software, data and methodologies to analyze their own data integrated with other data. Follow ProximityOne on Twitter at www.twitter.com/proximityone. Contact ProximityOne (888-364-7656) with questions about data covered in this section or to discuss custom estimates, projections or analyses for your areas of interest. |
|
|