
|
|
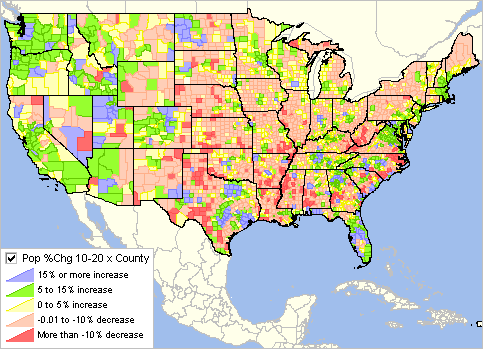
-- Census 2010, Census 2020 & Change 2010-20 -- expanding insights through data analytics August 2021 .. among the patterns often observed in county population change from Census 2010 to Census 2020 are the decline in the White alone population and increase in the some other race category. Use the interactive table below to examine county Census 2010, Census 2020, and population change. Query, sort, rank county demographics. Create county demographic profiles showing population by age, race/origin; group quarters and housing tenure .. for 2010, 2020 and change. What's happening in 2021 and ahead? These Census data are incorporated into development of the ProximityOne county annual projections to 2060. See Demographics 2060 update schedule. Patterns of Population Change by County, Census 2010 - Census 2020 The following graphic shows county population percent change from Census 2010 to Census 2020. Click graphic for larger view; expand browser window for best quality view.  .. use VDA Web GIS to view this scope of geography/subject matter dynamically .. start VDA and select "Base" project County Demographics: Census 2010, Census 2020 & Change Interactive table; click column header to sort; usage notes below table. See these data organized into a single county profile below See related Interactive Tables Main Page Table Usage Data presented in the table were first developed for all counties based on the Census 2020 P.L. 94-171 data. As a result, all geocodes and name references are as og 2020. Census 2010 data with the same scope of subject matter as for Census 2020, were then merged with the Census 2020 data based on the state+county match key. A few counties, mainly in Alaska, changed geocodes/geography during the period and have no matching relationship. Subject Matter Items Included in Above Table Items/columns presented in the
- Name
- St - GeoId - CBSA - CSA - Population 2010 - Population 2020 - Population Change 2010-20 - Population %Change 2010-20 - Population One Race 2010 - White alone 2020 - Black alone 2020 - AIAN alone 2020 - Asian alone 2020 - NHOPI alone 2020 - Other alone 2020 - Multi Race 2020 - White NonHisp 2020 - White NonHisp 2020 Percent - Black NonHisp 2020 - Hispanic (any race) 2020 - Hispanic (any race) 2020 percent - Population 18+ 2020 - Population 18+ One Race 2020 - White alone 18+ 2020 - Black alone 18+ 2020 - AIAN alone 18+ 2020 - Asian alone 18+ 2020 - NHOPI alone 18+ 2020 - Other alone 18+ 2020 - Multi Race 18+ 2020 - White 18+ NonHisp 2020 - Black 18+ NonHisp 2020 - Hispanic 18+ (any race) 2020 - Group Quarters 2020 - Group Quarters Inst 2020 - Group Quarters NonInst 2020 - Total Housing Units 2020 - Occupied Units 2020 - Vacant Units 2020 - Population 2010 - Population One Race 2010 - White alone 2010 - Black alone 2010 - AIAN alone 2010 - Asian alone 2010 - NHOPI alone 2010 - Other alone 2010 - Multi Race 2010 - White NonHisp 2010 - White NonHisp 2010 Percent - Black NonHisp 2010 - Hispanic (any race) 2010 - Hispanic (any race) 2010 percent - Population 18+ 2010 - Population 18+ One Race 2010 - White alone 18+ 2010 - Black alone 18+ 2010 - AIAN alone 18+ 2010 - Asian alone 18+ 2010 - NHOPI alone 18+ 2010 - Other alone 18+ 2010 - Multi Race 18+ 2010 - White 18+ NonHisp 2010 - Black 18+ NonHisp 2010 - Hispanic 18+ (any race) 2010 - Group Quarters 2010 - Group Quarters Inst 2010 - Group Quarters NonInst 2010 - Total Housing Units 2010 - Occupied Units 2010 - Vacant Units 2010 - Name 2010 - StFIPS 2010 - CtyFIPS 2010 Census 2010, Census 2020 & Change 2010-2020 County Table .. goto top In the interactive table above, Fresno County, CA is shown as one row. Below that row is reconfigured into a table showing descriptive stubs, percentages and change. This rendering the data is provided using the Situtation & Outlook report feature of the DEDE -- Demographic-Economic Data Extraction -- tool. See http://proximityone.com/dede.htm Fresno County, California .. Census 2010, Census 2020 and Change 2010-2020 .. using Census 2020 P.L. 94-171 data (released 8/12/21)
Support Using these Resources Learn more about accessing and using demographic-economic data and related analytical tools. Join us in a Data Analytics Lab session. There is no fee for these one-hour Web sessions. Each informal session is focused on a specific topic. The open structure also provides for Q&A and discussion of application issues of interest to participants. ProximityOne User Group Join the ProximityOne User Group to keep up-to-date with new developments relating to metros and component geography decision-making information resources. Receive updates and access to tools and resources available only to members. Use this form to join the User Group. Additional Information ProximityOne develops geodemographic-economic data and analytical tools and helps organizations knit together and use diverse data in a decision-making and analytical framework. We develop custom demographic/economic estimates and projections, develop geographic and geocoded address files, and assist with impact and geospatial analyses. Wide-ranging organizations use our tools (software, data, methodologies) to analyze their own data integrated with other data. Follow ProximityOne on Twitter at www.twitter.com/proximityone. Contact us (888-364-7656) with questions about data covered in this section or to discuss custom estimates, projections or analyses for your areas of interest. |
|
|