
|
|
Creating & Using Location Shapefiles .. GIS tools and methods to develop, update and use location shapefiles
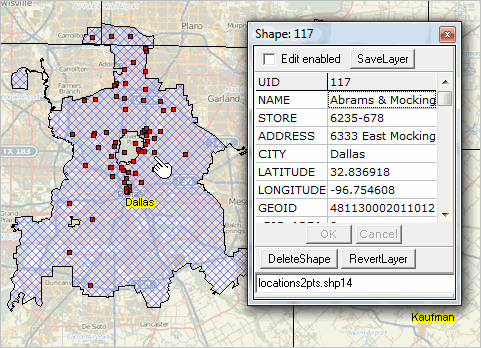
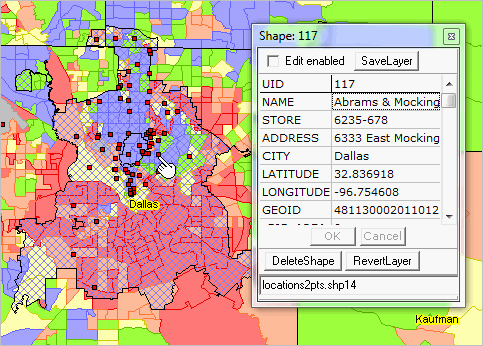
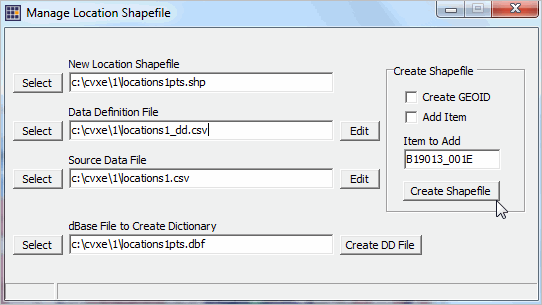
Updated 4/30/17 .. location shapefiles are essential to most GIS applications. Location shapefiles, or point shapefiles, enable viewing/analyzing locations on a map and attributes of these locations such store or customer ID, street address, city, date updated, value, ZIP code and wide-ranging attributes about the location. Using the manage location shapefiles tool, perform these tasks: • create a point shapefile to add to a GIS project. • optionally automatically add the census block geocode for the location; .. added as an attribute to the point data record. • optionally automatically add any ACS 2015 item for the location block group; .. added as an attribute to the point data record. Viewing/Analyzing Store Locations in the Dallas, TX Area The following graphic illustrates how store locations can be shown in context of other geography and associated demographic-economic attributes. This view shows store locations (red markers) in context of Dallas city (blue cross-hatch pattern) and broader metro area. Markers shown in this view are based on a location shapefile created using steps described below. The identify tool is used to click on a location and show attributes in a mini-profile.  .. view developed with ProximityOne CV XE GIS and related GIS project. View the locations contextually with thematic patterns by tract or other geography. Combine views of store, customer, agent, competitor and other location shapefiles. The following view shows patterns of median household income by census tract.  .. view developed with ProximityOne CV XE GIS and related GIS project. This section reviews the use of tools and methods to create location shapefiles. Development of location shapefiles often starts with a list of addresses. Locations are not always address-oriented; they might be geographically dispersed measurement or transaction locations -- having no address assigned. In applications reviewed here, locations are organized as rows in a CSV file. Each CSV file contains like-structured attributes for each location. The example used in this section uses store locations located in the Dallas, TX area. There are two basic methods used to create location shapefiles: 1) geocoding address-data contained in the source data file or 2) using the latitude-longitude of the location included in the source data file record. The focus here is on option 2 -- using the latitude-longitude of the location already present in the source data file. Creating a Location Shapefile The process of creating a location shapefile uses the CV XE GIS Manage Location Shapefile feature. With CV running, the process is started with File>Tools>ManageLocationShapefile. The following form appears.  .. ManageLocationShapefile feature/operation in ProximityOne CV XE GIS. CV XE GIS provides other ways to create location shapefiles: • Tools>AddShapes>Points -- click points on the map window canvas. • Tools>FindAddress -- creates a single point shapefile based on specified address. • Tools>FindAddress (Batch) -- creates a point shapefile based on specified file of address records. See details in User Guide. Steps to Create a Location Shapefile The process of creating the shapefile "C:\cvxe\1\locations1pts.shp" can be viewed by clicking the Create Shapefile button on the form (with CV running). Two input CSV structured files are required: • data definition file • source data file The name of the output shapefile is required and overwritten if it exists: There are two sets of illustration location input files included with the CV installer: • locations1_dd.csv and locations1.csv (7 locations in Johnson County, KS) • locations2_dd.csv and locations2.csv (252 locations in Texas, mainly Dallas and Houston) These files are located in the Data Definition File The Data Definition (DD) file is an ASCII/text file structured as a CSV file. It may created with any text editor. The DD file is specific to the source data file. But in the case of recurring source data files for different periods the same DD file might apply to many source data files. There are several rules and guidelines for development of the DD file: • there is one line/record for each field in the source data file. • each line/record must be structured in an exact form: .. each line/record is comprised of exactly 4 elements separated by a comma: .. 1 field name for subject matter item - must consist of 1 to 10 characters and include no blanks or special characters .. 2 field type: C for character, N for numeric .. 3 field length: an integer specifying the maximum with of the field .. 4 maximum number of decimals for field (value is 0 for character fields) LATITUDE,n,12,6 LONGITUDE,n,12,6 GEOID,c,15,0 The structure of these three DD file records must be as shown above. The source data file, described below, must have the LATITUDE and LONGITUDE fields populated with accurate values. The GEOID field may populated with either an accurate value of placeholder value like 0.
If you are adding a ACS 2015
subject matter item, a fourth DD File item is required:
[fieldname],n,9,0 where [fieldname] (do not include brackets) is the ACS2015 Census Bureau defined summary file subject matter field name. In the sample DD Files included with the installer, the fieldname "B19013_001E" (median household income) is used. Select any of the items for which block group estimates are available. Enter the exact case-sensitive spelling fieldname in the "Item to add" edit box (see form above). Field names are shown in this XLS file: • Table Shells - xls - use to determine items tabulated/available Tables for which field are tabulated at the block group level are shown in this XLS file: • Block Group Availability - xls - use to determine "by block group" availability See more in the ACS 2015 reference section. There is no validation for the subject matter field name entered. Example. Data for each store for the default DD file name "C:\cvxe\1\locations1_dd.csv" include the following fields/attributes: NAME,C,45,0 STORE,c,15,0 ADDRESS,c,60,0 CITY,c,40,0 LATITUDE,n,12,6 LONGITUDE,n,12,6 GEOID,c,15,0 B19013_001E,n,9,0 Optionally create a DD File using the Create DD File button on the form. Clicking this button will create a DD File containing attributes of the dBase file specified in the associated edit box. The DD File name is created from the dBase file name. If the dBase file name is "c:\cvxe\1\locations1pts.dbf", the DD File will be named "c:\cvxe\1\locations1pts_dd.csv". About the GEOID The GEOID is a 15 character code which defines the Census 2010 census block containing each location. The GEOID is generally assigned by the ManageLocationShapefile operation and is one of the important and distinctive features of this tool. The GEOID is used to uniquely determine, with the GIS application, any of the following: state, county, census tract, block group, or census block. The GEOID, as used in this section, is the 15 character Census 2010 geocode for the census block. The GEOID value 481130002011012 (see in location profile in map at top of section) is structured as: state FIPS code: 48 (2 chars) county FIPS code: 113 (3 chars) census tract code 000201 (6 chars) census block code: 1012 (4 chars) (containing the block groups code: 1 -- first of 4 characters) About the Source Data File The Source Data File is an ASCII/text file structured as a CSV file. It is typically developed by exporting/saving an Excel or dBase file in CSV structure. There are several rules and guidelines for development of the source data file: • fields must be structured and arranged as defined in the DD File. • character fields must not contain embedded commas. • final items in record sequence must be: .. LATITUDE - must have accurate decimal degree value; 6 digit precision suggested. .. LONGITUDE- must have accurate decimal degree value; 6 digit precision suggested. .. GEOID - this may be 0, not assigned or the accurately assigned GEOID value. - optionally have the application create/rewrite the GEOID used in the new shapefile. .. [fieldname] - this may be 0, not assigned or the accurately assigned value. - optionally have the application create/rewrite the [fieldname] used in the new shapefile. Additional Notes • optionally use/check use create GEOID and Add Item checkboxes before clicking Create Shapefile. • if the create GEOID and Add Item checkboxes are not checked, a shapefile will be created without these values. • to use the Add Item feature, both the create GEOID and Add Item checkboxes must be checked. Updates; Combining Vintages of Location Attributes Location based data might update frequently, even daily. The recommended method to add, update and extend the scope of location-based data is to create new address shapefiles corresponding to different vintages or dates covered. The structure of the files must be the same so that they files can be used together or separately. Suppose there is one set of data covering year to date and a second set of data covering the following month. The ManagePointShapefile operation would be run once for each time period. Two shapefiles would be created. These shapefiles may be added to a GIS project and used separately or in combination to view/analyze patterns. Support Using these Resources Learn more about accessing and using demographic-economic data and related analytical tools. Join us in a Data Analytics Lab session. There is no fee for these one-hour Web sessions. Each informal session is focused on a specific topic. The open structure also provides for Q&A and discussion of application issues of interest to participants. ProximityOne User Group Join the ProximityOne User Group to keep up-to-date with new developments relating to metros and component geography decision-making information resources. Receive updates and access to tools and resources available only to members. Use this form to join the User Group. Additional Information ProximityOne develops geodemographic-economic data and analytical tools and helps organizations knit together and use diverse data in a decision-making and analytical framework. We develop custom demographic/economic estimates and projections, develop geographic and geocoded address files, and assist with impact and geospatial analyses. Wide-ranging organizations use our tools (software, data, methodologies) to analyze their own data integrated with other data. Follow ProximityOne on Twitter at www.twitter.com/proximityone. Contact us (888-364-7656) with questions about data covered in this section or to discuss custom estimates, projections or analyses for your areas of interest. |
|
|