
|
|
|
GeoFinder ... interactive API tool to find geographies meeting your criteria
How many ZIP codes have a median household income of $100,000 or more? How to develop a list of these ZIP codes? a file that can be used in other applications? These are examples of why the GeoFinder tool can be useful. GeoFinder is a Windows-based tool that uses the Census Bureau API to display geographies of interest (e.g. ZIP Codes) data that meet a specified logical/statistical criteria. The Census Bureau API is an excellent resource to flexibly access statistical data. But it does not have the capability to query the data being accessed to determine which geographic areas meet user specified criteria. GeoFinder does. More geographic levels and APIs providing access to other data resources are available in Level 2. Patterns of Economic Prosperity: America's Largest Cities - cities with 2018 population 65,000+ shown as markers - markers show level of 2018 median household income - data used to develop this view were extracted using GeoFinder; see below - click map for larger view; expand browser to full screen for best quality view. 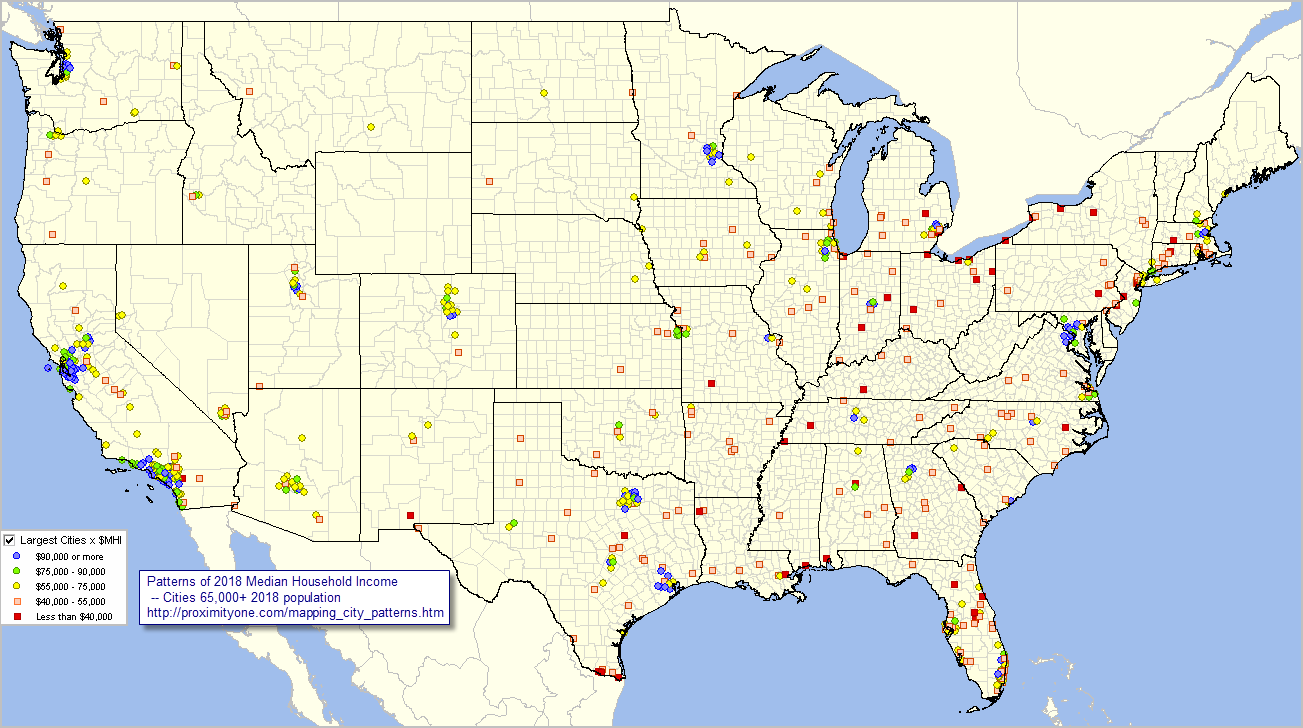 - view developed using ProximityOne CV XE GIS software and related GIS project. - see more about Mapping America's Cities Install GeoFinder GeoFinder Level 1 is available to User Group members at no fee. • Run the GeoFinder installer • Start GeoFinder from the desktop icon Using GeoFinder After installing, start using the desktop icon. At start-up, click the Find button in the upper left control section. The view appears as shown below. 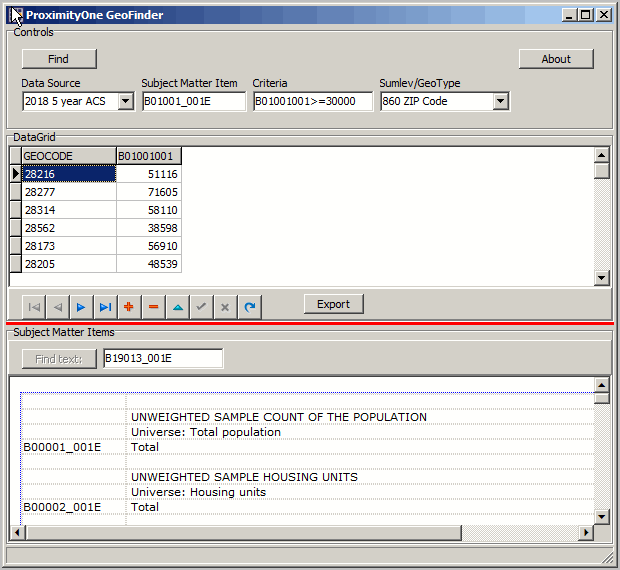
The GeoFinder Interface consists of three sections: • Control .. Find button to start a process. .. Data Source dropdown selection box. .. ACS 2017 1 year estimates .. ACS 2017 5 year estimates .. ACS 2018 1 year estimates .. ACS 2018 5 year estimates (default) .. Subject matter field edit box. .. the default value is B01001_001E -- the variable ID for total population. .. Query/criteria for a geographic area to be included in the list/count .. ACS 2017 1 year estimates .. the default value is B01001001>=30000. .. this SQL like statement says "locate all geographies where total population is greater than or equal to 30000". Note that the variable ID B01001_001E, as shown in the Census API metadata, must be exact,
whereas the value in the SQL editbox is trimmed to the 10 leftmost characters.
This is because the field name in the dbase file generated must be 10 characters or less.
.. Summary Level/Geo Type dropdown selection box... 040 State .. 160 City/Place .. 310 Metro/CBSA .. 500116th Congressional Districts .. 795 PUMA - Public Use Microdata Areas .. 860 ZIP Code Areas (default) .. Click the About button to view this section. • Data Grid .. Display of data resulting from the processing. .. Navigation bar for Data Grid navigation. .. There is one row shown for each geography meeting the Criteria. .. There are two columns shown; column 1 is the geocode, column 2 is the data value for this geocode. .. Click Export button to save the data shown in grid as a CSV file: c:\geofinder\gf2.csv. • Subject Matter items .. Metadata listing the subject matter available for queries. .. these data are derived from the Census Bureau API ACS metadata -- 2018 ACS Detailed Tables Variables .. scroll this section to locate subject matter of interest.. .. Variable IDs, that can be used in the Control section "ACS subject matter item" are shown in the left column. .. A Variable ID of interest may be copied and pasted in the ACS subject matter item" edit box. .. After pasting, to process that item, click the Find button. The Data grid refreshes. .. Optionally change the query/criteria edit box value. .. consider using B19013001>100000 for the Variable ID B19013_001E .. median household income. Files Created Upon completion on a processing, two files are written that are located in the c:\geofinder folder. The CSV file gf1.csv and dbase file gf1.dbf contain a record for all of the geographic areas processed, irrespective of meeting the citeria. They contain the same number of records and content, provided in different structures. These files are overwritten, replaced, each time the Find button is clicked. The dbase file may be merged with a corresponding shapefile using the companion CV XE GIS software, enabling a thematic map to be created. Mapping City Patterns The view at the top of this section was developed using data extracted with the GeoFinder tool. The settings were: 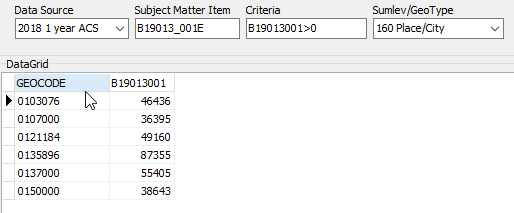 The ACS 2018 1-year estimates include 630 cities. The dbase file generated by GeoFinder was merged with the U.S. cities point shapefile. That shapefile was added to a GIS project. The attributes of the markers (color and $MHI values) were set using the CV XE GIS layer editor. The view shown at the top of the section was then captured using two zoom levels. Create your own maps similar these these. See more about Mapping America's Cities. Support Using these Resources Learn more about accessing and using demographic-economic data and related analytical tools. Join us in a Data Analytics Lab session. There is no fee for these one-hour Web sessions. Each informal session is focused on a specific topic. The open structure also provides for Q&A and discussion of application issues of interest to participants. ProximityOne User Group Join the ProximityOne User Group to keep up-to-date with new developments relating to geographic-demographic-economic decision-making information resources. Receive updates and access to tools and resources available only to members. Use this form to join the User Group. Additional Information ProximityOne develops geographic-demographic-economic data and analytical tools and helps organizations knit together and use diverse data in a decision-making and analytical framework. We develop custom demographic/economic estimates and projections, develop geographic and geocoded address files, and assist with impact and geospatial analyses. Wide-ranging organizations use our tools (software, data, methodologies) to analyze their own data integrated with other data. Follow ProximityOne on Twitter at www.twitter.com/proximityone. Contact ProximityOne (888-364-7656) with questions about data covered in this section or to discuss custom estimates, projections or analyses for your areas of interest. |
|
|