|
|
|
Assessing Healthcare Infrastructure; Supply & Demand
click graphic for info; hover to pause As the population ages, migrates and otherwise changes, healthcare needs change by location, type and in other ways. Current small area demographics of these demand measures are not readily available -- when knowing about changes in demand over the next several years is even more important. Changing economic circumstances and issues with insurance coverage affect the ability to pay and the demand for various healthcare resources. This section covers: • Examining Hospitals, Hospice Facilities and Demographic Patterns • Healthcare Analysis and Situation & Outlook • Accessing Detailed Demographic-Economic Data Using S&O Server • Examining Health Insurance Coverage -- interactive analysis table • Healthcare Infrastructure Analysis Using GIS School Age Population & Schools What healthcare facilities/resources are available to schools in the event of emergency? How does the health insurance coverage vary among school districts? More about health insurance coverage and school districts. Answers to these questions can be partly answered through use of data-driven resources reviewed in this section. Examining Hospitals, Hospice Facilities and Demographic Patterns See Gallery section http://proximityone.com/gallery/guide/index.htm?nashville_area.htm illustrating analysis of hospice locations in context of demographics with GIS tools in context of wide-ranging political, statistical and market analysis areas. Healthcare Analysis and Situation & Outlook The ProximityOne Situation & Outlook (S&O) Program is a combined database and interpretive resource that you can use to better understand the existing healthcare situation, find out how area demographic-economic conditions are changing, and assess how changing conditions might impact various components of the healthcare infrastructure. Access Detailed Demographic-Economic Attributes with S&O Server The S&O Server provides Web-based access using API technology to detailed demographic-economic data for wide-ranging geography from census block up. Integrate data from multiple sources to the item level of specificity. Choose from data resources including ProximityOne estimates & projections, 1990 Census, Census 2000, Census 2010, ACS 2010, annually through most recent ACS. Create your own spreadsheets using custom templates. Combine custom selected API-sourced subject matter with your own data; compare areas such as a city to county to metro. Examining Health Insurance Coverage in Context of Related Geography & Economic Characteristics The interactive ranking table below includes selected health insurance coverage demographics for areas of 65,000 population and over based on the American Community Survey 2011 1-year estimates. The 2012 estimates become available in September 2013. These data are a subset of data presented in the related interactive tables: • General Demographics -- http://proximityone.com/acs2011dp1.htm • Social Characteristics -- http://proximityone.com/acs2011dp2.htm • Economic Characteristics -- http://proximityone.com/acs2011dp3.htm • Housing Characteristics -- http://proximityone.com/acs2011dp4.htm Data focused on health insurance coverage are combined with measures of economic prosperity and educational attainment: median family and household income, percent families and persons in poverty and percent population high school/college graduates. Health insurance coverage data are presented as percentages of the total population. Using the table ... consider item E096, civilian noninstitutional population with health insurance coverage. E096, as a percent of total population, varies within MSAs from 62.4% in the McAllen-Edinburg-Mission, TX MSA to 95.6% in the Pittsfield, MA MSA. Use the ranking table to compare many other health insurance coverage attributes. See the health insurance coverage comparative analysis profile later in this section to view how these items are related. 2011 Health Insurance & Related Economic Characteristics -- Interactive Ranking Table ... U.S., States, Metros, School Districts, Cities, Counties, 112th Congressional Districts Click ShowAll button between Find/Queries; use mouse-over on column header to view description of item. See ranking table usage notes below ranking table. See related ranking tables -- http://proximityone.com/rankingtables.htm. Find in Name feature is case-sensitive. Searches for exact match (any set of characters) on column 1 (AreaName). Column Headers Index column not active this version. Numbered items ... each row in the above table corresponds to a geographic area and contains numbered subject matter items. The number items are the column headers in the table. Each numbered item is listed in the table shown below with a description of the subject matter item. This same description appears with a mouse-over of the column header. Use the scroll bar below the ranking table to scroll right to view numbered items in the ranking table that do show in the start-up view.
Geography Select type of geography using the "SumLev" (Summary Level) dropdown below the ranking table. • 040 States • 050 Counties (65,000 or more population) • 160 Cities/Places (65,000 or more population) • 310 Metros/MSAs (Census 2010 vintage) • 500 Congressional Districts (112th) • 900 School Districts (65,000 or more population) Using the Ranking Table • Click on a column header to sort on that column; click column header again to sort in other direction. • Click ShowAll button to show all areas and restore full set of data view. • Click State to select all areas in a selected state (click ShowAll between selections). • View additional rows/areas by sliding vertical scrollbar at table right. • Modify column width by dragging column separator in header row. • View additional columns by sliding horizontal scrollbar (leftmost columns remain fixed). • Data value of -1 indicates this estimate is not available. Health Insurance Coverage and Poverty Comparative Analysis Profile The table presented below shows selected health insurance coverage and poverty items, taken from the ranking table above, displayed as an organized comparative profile for three areas: Los Angeles Unified School District, State of California and the United States. To view attributes of health insurance coverage by school district, use the "900" summary level in the above ranking table (possibly first filtering by state). Rank on E099 (no health insurance coverage) to see that, among California school districts over 65,000 total population, Palo Alto Unified has the lowest percent population with no health insurance coverage (3.4%) compared to the Lynwood Unified with the highest (35.9%). Note that these estimates are only available, as of March 2013, for areas having 65,000 or more population.
Healthcare Infrastructure & GIS Use the CVXE GIS Visual Library to examine health-related characteristics in context of wide-ranging geography (tracts, cities, counties, metros, etc.) and multi-sourced demographic-economic attributes. Add U.S. national scope shapefiles are available for hospitals, nursing homes, and community healthcare centers. These shapefiles are an important part of the broader set of healthcare decision-making information resources. The following Oklahoma City, OK MSA area views illustrate how these shapefiles may be used. Oklahoma City, OK MSA counties shown with hatch pattern View location/distribution of hospitals, community healthcare centers, nursing homes in context of other geography 
Zoom-in to Oklahoma County; Identify tool used to show mini-profile of a community healthcare center 
Patterns of economic prosperity: median household income by census tract; Oklahoma County 
Further zoom-in; street detail with labeling; Oklahoma County 
Market/service area analysis ... Site analysis tool used to count number of hospitals within 50 miles of a selected location. 28 hospitals in this example (upper right) with IDs listed in lower right; extract shapefile automatically created. 
Market/service area analysis ... Site analysis tool used to examine demographics in 4 selected census tracts served by health care center. Census tract codes shown as yellow labels. "DP1001" is total population of 4 tracts (shown as cross hatched and listed in lower right box) aggregated. 
Market/service area analysis ... Larger set of tracts selected (18) with total population of 37,668 See broader set of "DP" items available at these web pages: DP1 .. DP2 .. DP3 .. DP4 
View characteristics of community healthcare centers in tabular format 
Review of Selected Analytical Tools & Resources • CVXE GIS • GIS & Health Care ProjectFilesets • U.S. by County Demographics Life Expectancy -- Healthcare ProjectFileset • U.S. Hospitals, Nursing Homes, Health Care Centers by Location -- Healthcare ProjectFileset • Healthcare Industry Establishments, Employment, Earnings -- updated quarterly • Situation & Outlook -- Demographic-Economic Estimates & Projections • Strategic processes to deploy healthcare decision-making information solutions CVXE GIS Use CVXE GIS on your computer with the U.S. Health Resources and Services Administration (HRSA) Area Resource File (ARF), updated annually, providing access to multi-sourced data on several thousand health care-related measures at the county level. Acquire the ARF data directly from HRSA; CVXE GIS works directly with the ARF data as distributed by HRSA. Integrate the ARF data with other data for spreadsheet, database, visual analysis, and other applications. Export the data for use with other software. Thematic Maps and Pattern Analysis  The CV map at the right shows the number of MDs per 1,000 population for the U.S. by county.
Darker red: no MDs, light red: 1 MD per 1,000, light blue: 1-3 MDs per 1,000, dark blue: 4 or more MDs per 1,000
population.
It is easy to see counties and regions that are relatively underserved by the availability of physicians.
Click graphic for larger view then press F11 key for best view.
Based on ARF sourced data, add other subject matter data for other geography as reviewed below.
The CV map at the right shows the number of MDs per 1,000 population for the U.S. by county.
Darker red: no MDs, light red: 1 MD per 1,000, light blue: 1-3 MDs per 1,000, dark blue: 4 or more MDs per 1,000
population.
It is easy to see counties and regions that are relatively underserved by the availability of physicians.
Click graphic for larger view then press F11 key for best view.
Based on ARF sourced data, add other subject matter data for other geography as reviewed below.
GIS & Healthcare ProjectFilesets We develop generalized and custom 'HealthCare ProjectFilesets' that provide ready-to-use decision-making information solutions. The HealthCare ProjectFilesets are comprised of a GIS project file and a set of shapefiles with integrated healthcare-related data. The HealthCare ProjectFilesets are ready for use with CV. However, CV is not required to use the health-related shapefiles and data, any software with ability to use shapefiles may use the HealthCare ProjectFilesets. U.S. by County Demographics Life Expectancy -- Healthcare ProjectFileset 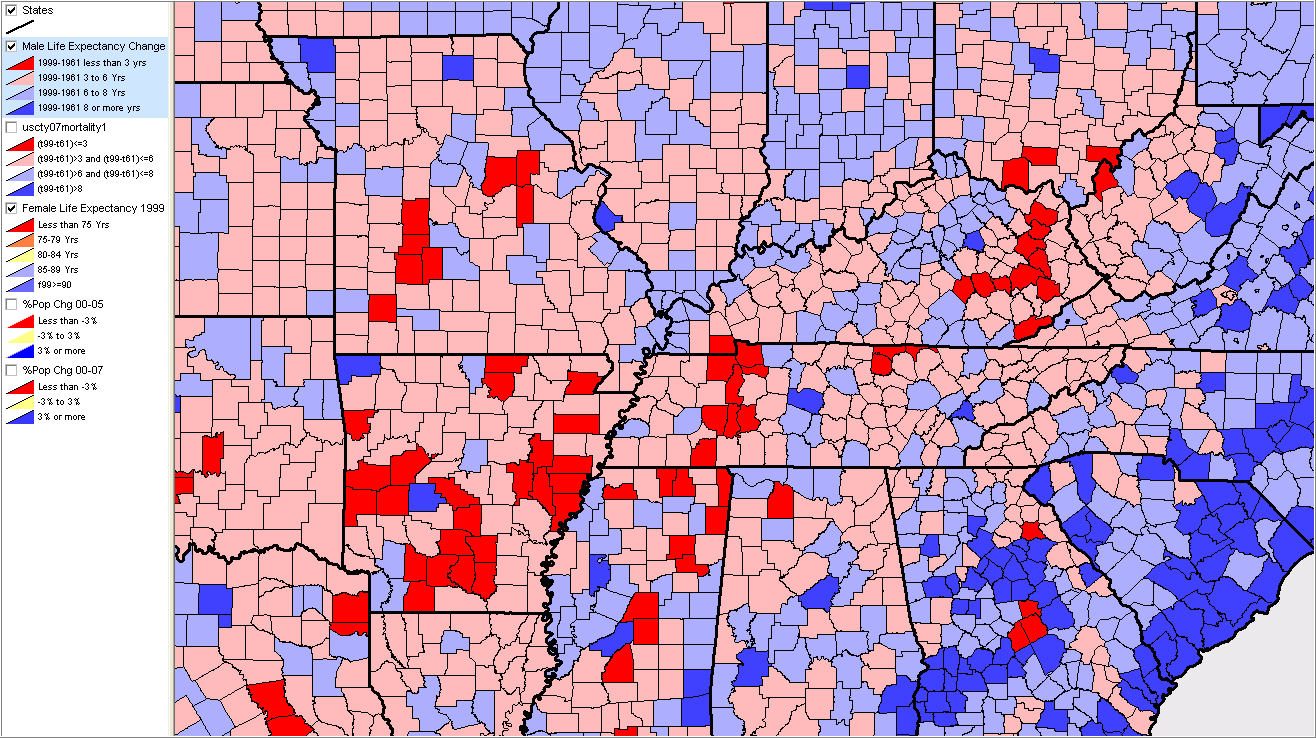 "Life Expectancy Drops for Some U.S. Women" ... data from PLoS Journal of Medicine (4/22/08).
This ProjectFileset is comprised of the
GIS project file, U.S. by County Life Expectancy demographics shapefile, U.S. by state boundary file, and U.S. by CBSA boundary shapefile.
Integrated time series demographics are included in the county and CBSA shapefiles.
Other shapefiles (e.g. streets) can be added using the CommunityViewer GeoGateway feature.
"Life Expectancy Drops for Some U.S. Women" ... data from PLoS Journal of Medicine (4/22/08).
This ProjectFileset is comprised of the
GIS project file, U.S. by County Life Expectancy demographics shapefile, U.S. by state boundary file, and U.S. by CBSA boundary shapefile.
Integrated time series demographics are included in the county and CBSA shapefiles.
Other shapefiles (e.g. streets) can be added using the CommunityViewer GeoGateway feature.
U.S. Hospitals, Nursing Homes, Health Care Centers by Location -- Healthcare ProjectFileset 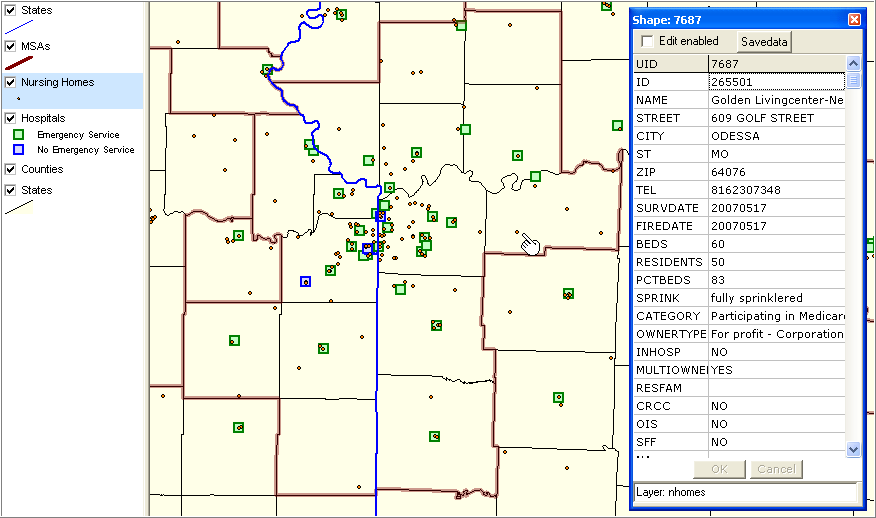 This ProjectFileset is comprised of the
GIS project file (national scope shapefiles with integrated attributes):
This ProjectFileset is comprised of the
GIS project file (national scope shapefiles with integrated attributes):• Hospitals (point) • Nursing homes (point) • Community healthcare centers (point) • States • CBSAs (metros) • Counties • Census tracts Integrated time series demographics are included in the county and CBSA shapefiles. Other shapefiles (e.g. streets) can be added using the CommunityViewer GeoGateway feature. Hospitals. ProximityOne has geocoded hospital address data collected and developed by the U.S. Department of Health and Human Services (DHHS) Hospital Compare program to enable geospatial analysis of acute care and critical access hospitals and associated attributes. The geocoded address data were then converted to a U.S. by hospital shapefile and related hospital attributes were integrated into the shapefile. Nursing Homes. ProximityOne has geocoded nursing home address data collected and developed by the U.S. Department of Health and Human Services (DHHS) Medicare Nursing Home Compare program to enable geospatial analysis of nursing homes. Community Health Care Centers. ProximityOne has geocoded community health care center address data collected and developed by the U.S. Department of Health and Human Services (DHHS) to enable geospatial analysis of these centers. Healthcare Industry Establishments, Employment, Earnings Healthcare industry establishments, employment and earnings, updated quarterly at the county and higher geographic levels, provide the most recent measure of healthcare industry composition and trends. Health-related industries include those in NAICS 62 (Excel file) -- Health Care and Social Assistance industries. Additional Information ProximityOne develops geographic-demographic-economic data and analytical tools and helps organizations knit together and use diverse data in a decision-making and analytical framework. We develop custom demographic/economic estimates and projections, develop geographic and geocoded address files, and assist with impact and geospatial analyses. Wide-ranging organizations use our tools (software, data, methodologies) to analyze their own data integrated with other data. Follow ProximityOne on Twitter at www.twitter.com/proximityone. Contact ProximityOne (888-364-7656) with questions about data covered in this section or to discuss custom estimates, projections or analyses for your areas of interest. |
|
|