
|
|
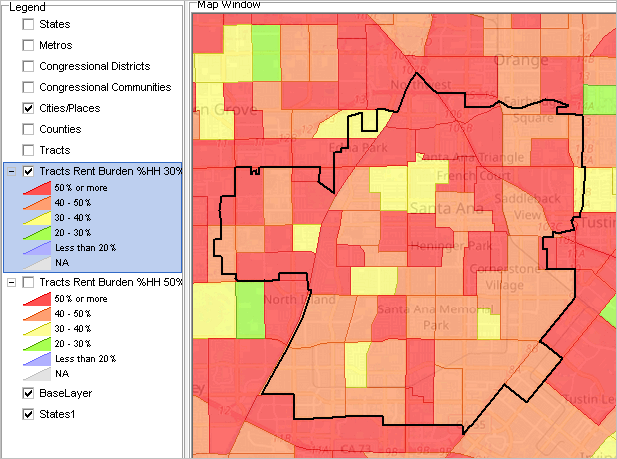
.. examining housing cost burden by census tract and other geography .. use data and tools described here to examine affordable housing Did you know? .. more than 40% (19 million) of renter households in the United States spend more than 30% of their income on housing costs .. based on data from the American Community Survey (ACS) 5-year estimates. Households spending more than 30% on housing costs, including rent or mortgage payments, utilities, and other fees, are considered housing cost burdened based on the Department of Housing and Urban Development definition of affordable housing. This section reviews how you can use the VDA Web GIS with the Housing project to examine housing cost burden on a national scale for a range of different types of geography .. down to the census tract level. Santa Ana, CA area to illustrate use of the data and tools. Data are provided in this section for three types of households (occupied housing units): owner occupied with mortgage, owner occupied with no mortgage and renter occupied. The graphics presented below are for only renter households. Use the interactive table below to examine any of the three types of households. Patterns of Renter Housing Cost Burden 30%+ by Census Tract .. Santa Ana, CA shown with bold black boundary. .. it is easy to see that most tracts have rental unit householders experincing housing cost burden. .. there is very little affordable rental housing. 
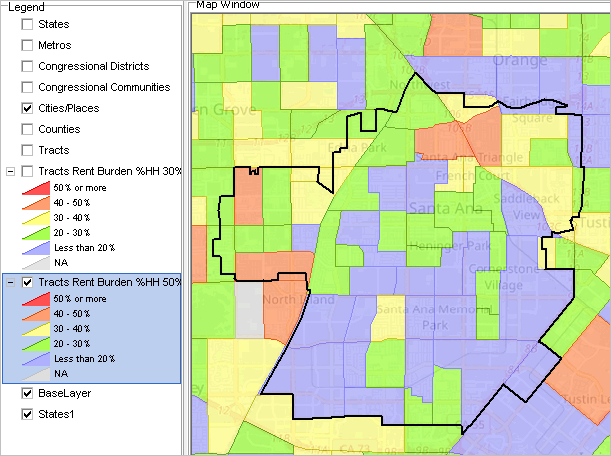
Patterns of Renter Housing Cost Burden 50%+ by Census Tract .. Santa Ana, CA shown with bold black boundary. .. it is easy to see that few tracts have rental unit householders experiencing extreme housing cost burden. 
Additional Graphics .. Affordable Rental Housing .. see below Housing Cost Burden by Census Tract .. goto top .. click to find a census tract code based on address/location .. step-by-step. .. click ShowAll button between queries. .. more usage notes below table. Table Usage Notes .. click ShowAll button between queries Subject Matter Details Gross Rent as a Percentage of Household Income (GRAPI) .. occupied units paying rent (excluding units where GRAPI cannot be computed) as a percent of household income. Selected Monthly Owner Costs as a Percentage of Household Income (SMOCAPI) .. housing units with/without a mortgage (excluding units where SMOCAPI cannot be computed) as a percent of household income. Data Fields and Illustrative Values .. goto top .. for each tract or area .. subject matter items described below are provided for each geographic layer type shown in the views shown above. states, metros, counties, cities/places, tracts .. subject matter data are based on ACS 2022 5-year estimates.
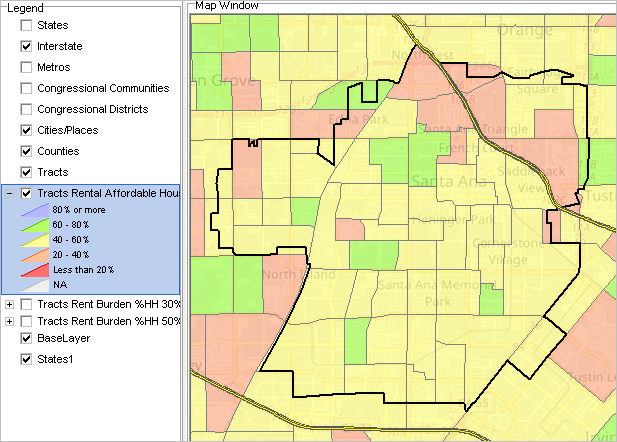
Patterns of Rental Affordable Housing .. Santa Ana, CA shown with bold black boundary. .. as measured by occupied rental units. .. neither total rental units nor vacant/available for rent units. 
Support Using these Resources .. goto top Learn more about accessing/using geographic, demographic, economic data and related analytical tools. Join us in a Data Analytics Lab session. There is no fee for these one-hour Web sessions. Each informal session is focused on a specific topic. The open structure also provides for Q&A and discussion of application issues of interest to participants. ProximityOne User Group Join the ProximityOne User Group to keep up-to-date with new developments relating to geographic-demographic-economic decision-making information resources. Receive updates and access to tools and resources available only to members. Use this form to join the User Group. Additional Information ProximityOne develops geographic-demographic-economic data and analytical tools and helps organizations knit together and use diverse data in a decision-making and analytical framework. We develop custom demographic/economic estimates and projections, develop geographic and geocoded address files, and assist with impact and geospatial analyses. Wide-ranging organizations use our tools (software, data, methodologies) to analyze their own data integrated with other data. Follow ProximityOne on Twitter at www.twitter.com/proximityone. Contact ProximityOne (888-364-7656) with questions about data covered in this section or to discuss custom estimates, projections or analyses for your areas of interest. | |||||||||||||||||||||||||||||||||||||||||||||||||||||||||||||||||||||||||||||||||||||||||||||||||||||||||||||||||||||||||||||||||||||
|
|