
|
|
|
Measuring the U.S. Economy -- by industry: home appliance manufacturing
There are many data resources to draw upon to analyze detailed industry characteristics and assess how their changing patterns affect regions and the national economy. Among the insights offered by the Census Bureau quinquennial economic census are from data on specific industries; data not otherwise available. The 2012 economic census (EC) data are now being released on a flow basis into 2015. This section profiles one industry -- for U.S. household appliance manufacturing (NAICS 3352) -- what economic census data are available, what related data are available, how to access the data and issues concerning use. These same topics may be applied to any type of business/industry category. How is this industry trending? How might these changes impact your business, markets or regional economy? In July 2014, the release of the 2012 Economic Census household appliance manufacturing data showed that the value of shipments for the nation's 95 household cooking appliance manufacturing establishments totaled $4.3 billion in 2012, down 10.8 percent from $4.9 billion in 2007. Industry Attribute Narrative A typical EC industry attribute narrative, for the household cooking appliance manufacturing industry, is as follows. The household cooking appliance manufacturing industry employed 10,324 people in 2012, down 34.0 percent from 15,638 in 2007. Average payroll per employee increased 23.0 percent from $30,199 in 2007 to $37,143 in 2012. The average number of employees per establishment in this industry decreased 20.1 percent, from 136 in 2007 to 109 in 2012. Household Appliance Manufacturing Industries by NAICS Code The household appliance manufacturing industries are shown in the table below by NAICS code.
Accessing Industry Data -- examples using industry 335221 Selected resources are reviewed below which may be used to access/develop industry data by detailed NAICS levels. 1. Use the economic census report portal to view industry characteristics. Industry 335221 Snapshot  Click graphic for larger view. Value of Shipments; NAICS 335221 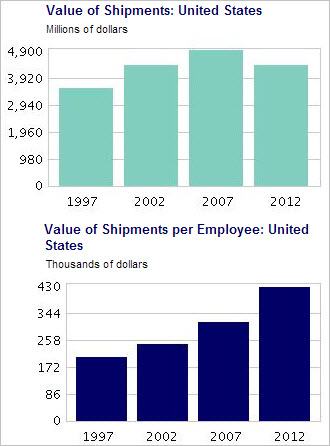 Click graphic for larger view. Click this link to access similar data for an industry. 2. Access different types of Census-sourced data available for industry 335221. The Industry Statistics Portal allows a user to select a single NAICS code and the tool returns a list of all of the Census statistical programs that provide data for that industry. The tool provides a nice definition of the industry as well as information about comparability of the industry over the various vintages of NAICS. To use this tool, go to the Topics menu on census.gov, place your cursor over the word "Economy" and then select the Industry Statistics Portal from the list. You can then choose the industry of interest by either selecting it from the menu/tree on the left or from the search box on the right. Entering the NAICS code 335221 generates a view of Census-sourced data for this industry as shown below. 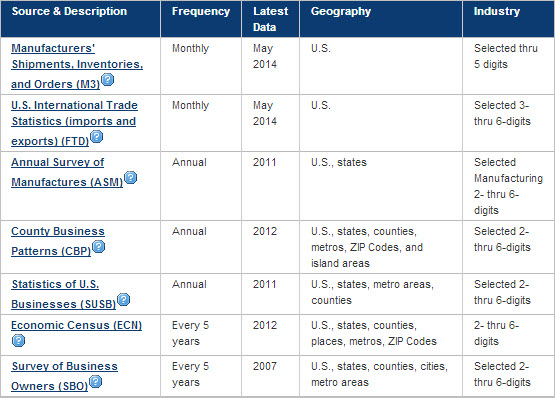
3. Access establishments, employment and wages BLS/CEW data for industry 335221. The BLS Census of Employment and Wages provides quarterly establishments, employment and wages data based on employer reports. These quarterly and annual time-series data are available down to the county level of geography. These data provide the most recent industry characteristics. The following table shows these data for 2012 and 2013. NAICS 335221 Household cooking appliance manufacturing
Click this link to access similar data for an industry. 4. Characteristics of the employed population for industry 335221 While no demographic-economic data are tabulated from the American Community Survey (ACS) at the NAICS 6-digit level, employment data by 1- and 2-digit NAICS level are available by census tract, county and other geography. Develop annual custom estimates of the employed population, and their attributes and household attributes by using the ACS Public Use Microdata Samples (PUMS) files. Develop these estimates for Public Use Microdata Areas (PUMA). PUMAs are groups of contiguus census tracts and have a minimum population of 100,000. For example, Los Angeles County, CA is comprised of 69 PUMAs. 5. Modeling Applications; Projections of Industry Attributes; Alternative Scenarios The ProximityOne 5-year annual projections (DE6 series) use the BLS/CEW data (item 3 above) in combination with other data to develop projections at the county level and for higher level geography. While these data are focused on 1- and 2-digit data, the model can be adapted to develop projections for other, more detailed, industries. 6. Regional Input-Output Modeling System The Bureau of Economic Analysis Regional Input-Output Modeling System (RIMS) produces regional multipliers that can be used in economic impact studies to estimate the total economic impact of a project on a region. RIMS includes more than 400 industry sectors. Among these industries, for example, are household appliance manufacturing (NAICS 3352) and associated 6-digit more detailed industries (see list in above table). Support with Accessing, Integrating and Using these Data Learn more about using resources described in this section. Join us in a Decision-Making Information Web session. There is no fee for these one-hour Web sessions. Each informal session is focused on a specific topic. The open structure also provides for Q&A and discussion of application issues of interest to participants. We can address your specific questions about using industry data and related applications. Additional Information ProximityOne develops geographic-demographic-economic data and analytical tools and helps organizations knit together and use diverse data in a decision-making and analytical framework. We develop custom demographic/economic estimates and projections, develop geographic and geocoded address files, and assist with impact and geospatial analyses. Wide-ranging organizations use our tools (software, data, methodologies) to analyze their own data integrated with other data. Follow ProximityOne on Twitter at www.twitter.com/proximityone. Contact ProximityOne (888-364-7656) with questions about data covered in this section or to discuss custom estimates, projections or analyses for your areas of interest. |
|
|