
|
|
|
Millennials: Where are the Best Cities to Live & Work in 2016
Best Cities for Millennials to Live & Work -- using one method The following graphic shows the start-up view of the CVGIS "millennials1.gis" (provided with the CVGIS installer). Metros (MSAs) are shown with orange/salmon fill patterns. Markers show best cities for Millennials. More detailed views are shown below in this section.  ... view developed using the CVGIS software. ... click graphic for larger view. While use of quantitative data is essential in this process, there are also many subjective factors to consider. As individual preferences and constraints are factored in, it is apparent that there is not one list of "best cities." It is a process of examining between alternative data and methodologies. Millennial GIS Project and Data Our starting place is using the CVGIS millennials1.gis project. The CVGIS installer makes this GIS project and data available on your computer to proceed through steps described in this section. Methodology A simple methodology is used that can be expanded as desired. We start with "places to live and work" as the set of U.S. cities defined by the Census Bureau. These cities are represented in the CVGIS millennials1.gis project by the shapefile places2015pts.shp. This point shapefile has been developed by ProximityOne by augmenting the TIGER 2015 shapefile. That shapefile has been populated with selected city/place data further described below. We use a variation on this query to select three groups of "Millennial Best Cities to Live & Work": POP2015>=20000 and lsad2='M1' and pop1015p>=8 and ad5_w5>=30 This query says the city: • must be a place with 2015 population of 20,000 or more • must be in an MSA (metropolitan statistical area) • have a population percent growth 2010-15 must be 8% or more • have item ad5_w5 value of 30 or more (a "most preferred" factor) The item ad5_w5 could be defined in many ways. In this application the factor uses two data items: • percent population ages 24-35 -- we want places having higher proportions of this age group. • percent population change 2010-15 -- we want places that are growing rapidly. .. In this query, equal weights are applied to these two items (0.5): .. ad5_w5 = 0.5* percent population ages 24-35 + 0.5* percent population change 2010-15 .. those with negative value are dropped The constant value 0.5 is a weight, in this case equal, that someone might assign differently. Many other items are in the city/places layer that can be used. These include employment/unemployment, educational attainment, commute time, income, poverty, housing owned/rented, housing age, housing age, housing value, housing rent, cost of living among others. Many physical access attributes (major airports, interstate, recreation, shopping, etc.) are identified by city size and MSA location. Our GIS project design is to create three layers, so that they can be easily viewed separately or in combination. See these layers in the legend at left of the map window in the graphics shown below. The same shapefile is used with each layer. Each layer has a different query applied. Using the GIS tools, the query may be easily changed to examine alternative weights and factors, labels may be used, differ markers can be viewed, other subject matter and geography can be shown contextually. The Results In the following views, metros (MSAs) are shown with an orange/salmon color fill pattern. Cities meeting the criteria appear as different styled markers. What about a city of interest that does not appear in these views? It is because that city does not meet at least one criteria. Places where ad5_w5 >=30 (POP2015>=20000 and lsad2='M1' and pop1015p>=8 and ad5_w5>=30)  ... view developed using the CVGIS software. Places where ad5_w5 >=20 and <30  ... view developed using the CVGIS software. Places where ad5_w5 >=10 and <20  ... view developed using the CVGIS software. Zoom into Texas or 30+  ... click for larger view ... view developed using the CVGIS software. Viewing Cities in Context of Economic Prosperity by County - MSAs shown with bold boundaries. - thematic pattern of median household income by county. - Texas cities shown in above graphic shown below with name labels. - Identify tool used to click on San Marcos to show mini-profile.  ... view developed using the CVGIS software. More About City/Place Demographic-Economic Data and Data Analytics Tools U.S. national scope annually updated city/place demographic-economic datasets contain approximately 600 subject matter items tabulated for each city/place organized into four subject matter groups: • General Demographics • Social Characteristics • Economic Characteristics • Housing Characteristics Use the interactive table in this section to view, query, rank, compare general demographics for all places in the U.S. Data in this section are based on the American Community Survey (ACS) 2014 5-year estimates. • City/Place Population Estimates - annual 2010-2015 • Similar tables: School Districts | Census Tracts | ZIP Codes • See earlier U.S. national scope ACS 2012 city/place interactive tables. • See related ACS 2014 1-year data U.S, states, metros interactive tables Visual Analysis of City/Place Population Dynamics Use the CV XE GIS software with city/place GIS project to examine characteristics of city/place population. The following view shows patterns of population percent change by city in the Charlotte, NC/SC metro area. 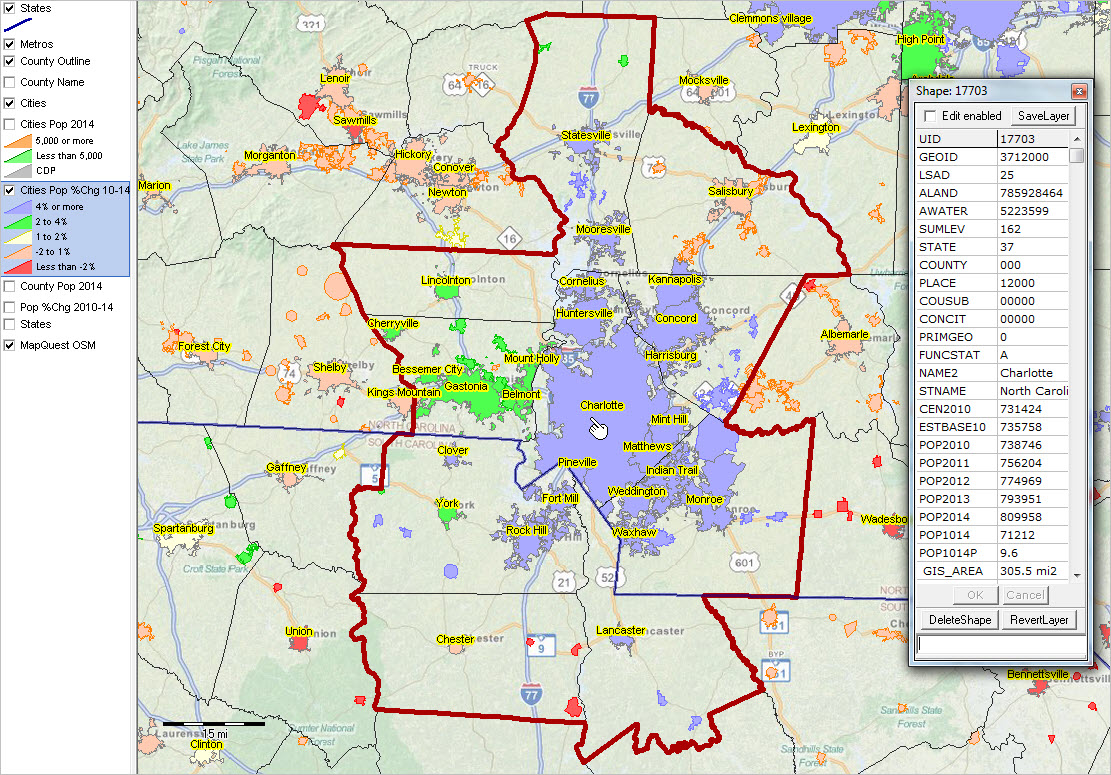 ... view developed using the CVGIS software. ... click map for larger view and details including city name. Support Using these Resources Learn more about accessing and using demographic-economic data and related analytical tools. Join us in a Data Analytics Lab session. There is no fee for these one-hour Web sessions. Each informal session is focused on a specific topic. The open structure also provides for Q&A and discussion of application issues of interest to participants. Additional Information ProximityOne develops geodemographic-economic data and analytical tools and helps organizations knit together and use diverse data in a decision-making and analytical framework. We develop custom demographic/economic estimates and projections, develop geographic and geocoded address files, and assist with impact and geospatial analyses. Wide-ranging organizations use our tools (software, data, methodologies) to analyze their own data integrated with other data. Follow ProximityOne on Twitter at www.twitter.com/proximityone. Contact us (888-364-7656) with questions about data covered in this section or to discuss custom estimates, projections or analyses for your areas of interest. |
|
|