Situation & Outlook
Related Sections
- Applications Gallery
- States
- School Districts
- Metros
- Congressional District
- Counties
- Tracts/Neighborhoods
- Block Groups
- Census Blocks
- ZIP Codes
- Urban Areas
Demographic-Economic
Estimates-Projections
GIS Thematic Mapping
Visual Analysis Tools
Ranking Tables
National Scope
Demographic Change
2000-2010
- States
- Metros
- Congressional District
- School Districts
- Counties
- Cities/Places
- Census Tracts
|
|
Warren County, Iowa: Integrated Demographic-Economic Profile
Decision-Making Information

|
ProximityOne
information resources & solutions
(888) DMI-SOLN
(888) 364-7656
|
Visual analysis with ProximityOne tools
click graphic for info; hover to pause
|
This section presents a snapshot "integrated demographic-economic profile" for Warren County, Iowa.
This profile is generated by the CV XE API Gateway and can be developed for any county in the U.S.
Data contained in the profile are accessed by the API Gateway using data from several servers.
Many data in the profile are dynamically updated; running the application at a later date will include updated data.
Some data update annually while other update monthly. Users have control over some subject matter displayed such as
industry selection for the quarterly establishments, employment and earnings.
You can develop/view this profile for any county using the no fee, no registration version of CV XE.
See more about installation of the CV XE package.
These data are part of the ProximityOne Situation & Outlook,
decision-making information resources to help stakeholders assess the
what, when and where of change and the impact of change.
See related population estimates and projections interactive table for all counties.
-- http://proximityone.com/demographics2060.htm
-- More about demographic-economic estimates and projections:
• Outlook 2018 |
Outlook 2030 |
Outlook 2060 |
Quarterly 3 year
• integrated multi-sourced Situation & Outlook demographic-economic data
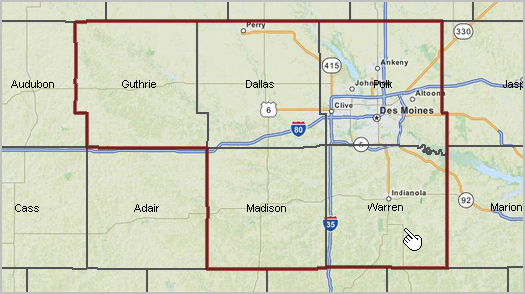
Warren County, Iowa (pointer) in context of Des Moines, Iowa MSA
See related population estimates and projections for Warren County.
Warren County IA (19181) CV APIgateway Integrated Demographic-Economic Profile
| Warren County, IA (19181) | | | | | | | | | | | | | |
| 2013 CBSA: Des Moines-West Des Moines, IA (MSA) | 2009 | 2010 | 2011 | 2012 | | | | | | | | | |
| �� Per Capita Real GDP($) | 60,037 | 60,047 | 60,876 | 61,777 | | | | | | | | | |
| �� GDP (Current$, millions) | 36,941 | 38,180 | 39,962 | 42,129 | | | | | | | | | |
| �� Real GDP (Real 2005$, millions) | 33,777 | 34,347 | 35,352 | 36,387 | | | | | | | | | |
| �� | | | | | | | | | | | | | |
| County Attributes | Census 2000 | ACS2010 5yr | ACS2011 5yr | Census 2010 | ACS2012 5yr | 7/10 Estimate | 7/11 Estimate | 7/12 Estimate | | | | | |
| Population by Race | | | | | | | | | | | | | |
| . Total population | 40,671 | 45,346 | 45,859 | 46,225 | | 46,305 | 46,623 | 46,891 | | | | | |
| .. White alone | 39,889 | 44,215 | 44,588 | 44,887 | | 45,220 | 45,401 | 45,715 | | | | | |
| .. Black or African American alone | 108 | 263 | 275 | 216 | | 219 | 322 | 278 | | | | | |
| .. American Indian and Alaska Native alone | 71 | 42 | 29 | 109 | | 120 | 131 | 118 | | | | | |
| .. Asian alone | 156 | 242 | 237 | 250 | | 250 | 247 | 265 | | | | | |
| .. Native Hawaiian and Other Pacific Islander alone | 18 | 0 | 0 | 11 | | 10 | 15 | 18 | | | | | |
| .. Some Other Race alone | 118 | 168 | 206 | 190 | | ... | ... | ... | | | | | |
| .. Two or More Races | 311 | 416 | 524 | 562 | | 486 | 507 | 497 | | | | | |
| | | | | | | | | | | | | |
| Hispanic Population by Race | | | | | | | | | | | | | |
| . Hispanic, Total | 441 | 816 | 854 | 899 | | 898 | 904 | 959 | | | | | |
| .. Hispanic - White alone | 254 | 630 | 588 | 621 | | 830 | 823 | 881 | | | | | |
| .. Hispanic - Black alone | 2 | 0 | 0 | 3 | | 4 | 8 | 7 | | | | | |
| .. Hispanic - AIAN alone | 5 | 0 | 0 | 13 | | 23 | 26 | 25 | | | | | |
| .. Hispanic - Asian alone | 1 | 0 | 0 | 1 | | 1 | 1 | 1 | | | | | |
| .. Hispanic - NHPI alone | 2 | 0 | 0 | 1 | | 1 | 1 | 1 | | | | | |
| .. Hispanic - Some Other Race alone | 106 | 151 | 187 | 154 | | ... | ... | ... | | | | | |
| .. Hispanic - Two or More Races | 71 | 35 | 79 | 106 | | 39 | 45 | 44 | | | | | |
| | | | | | | | | | | | | |
| Population by Age: Total Population | 40,671 | 45,346 | 45,859 | 46,225 | | 46,305 | 46,623 | 46,891 | | | | | |
| .. 0- 4 years | 2,778 | 2,912 | 2,940 | 2,974 | ... | 46,305 | 46,623 | 46,891 | | | | | |
| .. 5- 9 years | 3,003 | 3,398 | 3,424 | 3,307 | ... | 3,301 | 3,265 | 3,255 | | | | | |
| .. 10-14 years | 3,243 | 3,443 | 3,409 | 3,655 | ... | 3,656 | 3,676 | 3,657 | | | | | |
| .. 15-19 years | 3,317 | 3,560 | 3,641 | 3,530 | ... | 3,523 | 3,650 | 3,602 | | | | | |
| .. 20-24 years | 2,587 | 2,805 | 2,838 | 2,771 | ... | 2,780 | 2,749 | 2,873 | | | | | |
| .. 25-29 years | 2,137 | 2,371 | 2,433 | 2,449 | ... | 2,459 | 2,470 | 2,339 | | | | | |
| .. 30-34 years | 2,629 | 2,484 | 2,519 | 2,581 | ... | 2,598 | 2,702 | 2,813 | | | | | |
| .. 35-39 years | 3,362 | 2,917 | 2,869 | 2,997 | ... | 2,974 | 2,826 | 2,687 | | | | | |
| .. 40-44 years | 3,346 | 3,437 | 3,418 | 3,226 | | 3,226 | 3,228 | 3,329 | | | | | |
| .. 45-49 years | 3,099 | 3,640 | 3,580 | 3,600 | | 3,585 | 3,471 | 3,402 | | | | | |
| .. 50-54 years | 2,676 | 3,253 | 3,328 | 3,361 | | 3,368 | 3,488 | 3,556 | | | | | |
| .. 55-59 years | 2,064 | 2,940 | 2,935 | 3,017 | | 3,039 | 3,057 | 3,061 | | | | | |
| .. 60-64 years | 1,615 | 2,295 | 2,496 | 2,598 | | 2,626 | 2,765 | 2,757 | | | | | |
| .. 65-69 years | 1,379 | 1,746 | 1,816 | 1,887 | | 1,902 | 1,935 | 2,146 | | | | | |
| .. 70-74 years | 1,049 | 1,360 | 1,353 | 1,382 | | 1,393 | 1,494 | 1,553 | | | | | |
| .. 75-79 years | 973 | 1,202 | 1,276 | 1,167 | | 1,169 | 1,164 | 1,173 | | | | | |
| .. 80-84 years | 711 | 670 | 705 | 820 | | 825 | 829 | 849 | | | | | |
| .. 85 years or more | 703 | 913 | 879 | 903 | | 911 | 961 | 985 | | | | | |
| | | | | | | | | | | | | |
| Civilian Labor Force | 22,803 | 25,613 | 26,001 | ... | | | | | | | | | |
| .. Male | 11,785 | 12,918 | 13,182 | ... | | | | | | | | | |
| .. Female | 11,018 | 12,695 | 12,819 | ... | | | | | | | | | |
| | | | | | | | | | | | | |
| Median Household Income ($) | 50,349 | 62,034 | 63,292 | ... | | | | | | | | | |
| | | | | | | | | | | | | |
| Housing Units | 15,289 | 17,931 | 18,215 | 18,371 | | | | | | | | | |
| .. Occupied | 14,708 | 17,008 | 17,222 | 17,262 | | | | | | | | | |
| .... Owner | 11,750 | 13,457 | 13,675 | 13,776 | | | | | | | | | |
| .... Renter | 2,958 | 3,551 | 3,547 | 3,486 | | | | | | | | | |
| .. Vacant | 581 | 923 | 993 | 1,109 | | | | | | | | | |
| | | | | | | | | | | | | |
| Median Value ($) | 102,600 | 150,900 | 151,300 | ... | | | | | | | | | |
| Median Year Built | 1972 | 1975 | 1975 | ... | | | | | | | | | |
| | | | | | | | | | | | | |
| | | | | | | | | | | | | |
| BLS QCEW Industry: 10 Owner: 5 | | | | | | | | | | | | | |
| 10 Total, all industries | Jan | Feb | Mar | Apr | May | Jun | Jul | Aug | Sep | Oct | Nov | Dec | Annual |
| .. Employment 2011 | 7,023 | 6,991 | 7,154 | 7,415 | 7,458 | 7,550 | 7,610 | 7,575 | 7,506 | 7,417 | 7,329 | 7,223 | 7,354 |
| .. Employment 2012 | 7,065 | 7,075 | 7,227 | 7,587 | 7,725 | 7,848 | 7,956 | 7,857 | 8,020 | 7,569 | 7,600 | 7,447 | 7,581 |
| .. Employment 2013 | 7,139 | 7,252 | 7,330 | | | | | | | | | | |
| .. Employment 2014 | | | | | | | | | | | | | |
| | | | | | | | | | | | | |
| 10 Total, all industries | Q1 | Q2 | Q3 | Q4 | Annual | | | | | | | | |
| .. Establishments 2011 | 801 | 796 | 787 | 803 | 797 | | | | | | | | |
| .. Establishments 2012 | 813 | 821 | 837 | 841 | 828 | | | | | | | | |
| .. Establishments 2013 | 846 | | | | | | | | | | | | |
| .. Establishments 2014 | | | | | | | | | | | | | |
| | | | | | | | | | | | | |
| 10 Total, all industries | Q1 | Q2 | Q3 | Q4 | Annual | | | | | | | | |
| .. Total Wages ($000) 2011 | 51,307 | 57,186 | 62,808 | 60,639 | 231,941 | | | | | | | | |
| .. Total Wages ($000) 2012 | 54,800 | 60,389 | 62,008 | 62,877 | 240,074 | | | | | | | | |
| .. Total Wages ($000) 2013 | 56,928 | | | | | | | | | | | | |
| .. Total Wages ($000) 2014 | | | | | | | | | | | | | |
| | | | | | | | | | | | | |
| 10 Total, all industries | Q1 | Q2 | Q3 | Q4 | Annual | | | | | | | | |
| .. Average Weekly Wages ($) 2011 | 559 | 589 | 639 | 637 | 607 | | | | | | | | |
| .. Average Weekly Wages ($) 2012 | 592 | 602 | 600 | 642 | 609 | | | | | | | | |
| .. Average Weekly Wages ($) 2013 | 605 | | | | | | | | | | | | |
| .. Average Weekly Wages ($) 2014 | | | | | | | | | | | | | |
| | | | | | | | | | | | | |
| BLS LAU | | | | | | | | | | | | | |
| Labor Force: LAUCN19181006 | Jan | Feb | Mar | Apr | May | Jun | Jul | Aug | Sep | Oct | Nov | Dec | Annual |
| .. Labor Force 2011 | 25,401 | 25,449 | 25,360 | 25,464 | 25,354 | 25,513 | 25,766 | 25,510 | 25,249 | 25,309 | 25,422 | 25,123 | 25,410 |
| .. Labor Force 2012 | 25,172 | 25,244 | 25,220 | 25,325 | 25,325 | 25,604 | 25,672 | 25,471 | 25,300 | 25,425 | 25,134 | 25,082 | 25,332 |
| .. Labor Force 2013 | 25,213 | 25,545 | 25,664 | 25,783 | 25,710 | 26,027 | 26,141 | 25,830 | .. | .. | .. | .. | .. |
| | | | | | | | | | | | | |
| BLS LAU | | | | | | | | | | | | | |
| Employment: LAUCN19181005 | Jan | Feb | Mar | Apr | May | Jun | Jul | Aug | Sep | Oct | Nov | Dec | Annual |
| .. Employment 2011 | 23,671 | 23,772 | 23,759 | 24,055 | 24,051 | 24,130 | 24,477 | 24,164 | 23,954 | 24,066 | 24,178 | 23,791 | 24,006 |
| .. Employment 2012 | 23,624 | 23,719 | 23,765 | 24,021 | 24,076 | 24,350 | 24,457 | 24,223 | 24,183 | 24,284 | 23,983 | 23,802 | 24,041 |
| .. Employment 2013 | 23,699 | 24,118 | 24,330 | 24,624 | 24,621 | 24,883 | 25,055 | 24,742 | .. | .. | .. | .. | .. |
| | | | | | | | | | | | | |
| BLS LAU | | | | | | | | | | | | | |
| Unemployment: LAUCN19181004 | Jan | Feb | Mar | Apr | May | Jun | Jul | Aug | Sep | Oct | Nov | Dec | Annual |
| .. Unemployment 2011 | 1,730 | 1,677 | 1,601 | 1,409 | 1,303 | 1,383 | 1,289 | 1,346 | 1,295 | 1,243 | 1,244 | 1,332 | 1,404 |
| .. Unemployment 2012 | 1,548 | 1,525 | 1,455 | 1,304 | 1,249 | 1,254 | 1,215 | 1,248 | 1,117 | 1,141 | 1,151 | 1,280 | 1,291 |
| .. Unemployment 2013 | 1,514 | 1,427 | 1,334 | 1,159 | 1,089 | 1,144 | 1,086 | 1,088 | .. | .. | .. | .. | .. |
| | | | | | | | | | | | | |
| BLS LAU | | | | | | | | | | | | | |
| Unemployment Rate: LAUCN19181003 | Jan | Feb | Mar | Apr | May | Jun | Jul | Aug | Sep | Oct | Nov | Dec | Annual |
| .. Unemployment rate 2011 | 6.8 | 6.6 | 6.3 | 5.5 | 5.1 | 5.4 | 5.0 | 5.3 | 5.1 | 4.9 | 4.9 | 5.3 | 5.5 |
| .. Unemployment rate 2012 | 6.1 | 6.0 | 5.8 | 5.1 | 4.9 | 4.9 | 4.7 | 4.9 | 4.4 | 4.5 | 4.6 | 5.1 | 5.1 |
| .. Unemployment rate 2013 | 6.0 | 5.6 | 5.2 | 4.5 | 4.2 | 4.4 | 4.2 | 4.2 | .. | .. | .. | .. | .. |
| | | | | | | | | | | | | | |
| Notes | | | | | | | | | | | | | |
| "..." data not available for this item | | | | | | | | | | | | | |
| Usage, Structure and Sources | | | | | | | | | | | | | |
| Developed using CV XE GIS APIGateway | | | | | | | | | | | | | |
| Additional Information: (888)364-7656 | | | | | | | | | | | | | |
Terms of Use. Resources made available via this Web page
are proprietary to ProximityOne.
The resources may be used in any manner without further authorization
provided that full reference to this section/URL is provided.
Links to this page are encouraged as well as use of the data in stories and analyses.
Any use of these resources is solely at the discretion of the user.
There is no warranty or guarantee of any type.
Additional Information
ProximityOne develops geographic-demographic-economic data and analytical tools and helps organizations knit together and use diverse data in a decision-making and analytical framework. We develop custom demographic/economic estimates and projections, develop geographic and geocoded address files, and assist with impact and geospatial analyses.
Wide-ranging organizations use our tools (software, data, methodologies) to analyze their own data integrated with other data.
Follow ProximityOne on Twitter at
www.twitter.com/proximityone.
Contact ProximityOne (888-364-7656) with questions about data covered in this section or to discuss custom estimates, projections or analyses for your areas of interest.
|