
| Decision-Making Information |
|
ProximityOne information resources & solutions (888) DMI-SOLN (888) 364-7656 Put data to work more effectively. Certificate in Data Analytics Power of Combining Maps with Data Support & Technical Assistance help using these resources |
Situation & Outlook Report
ZIP Code Area 66224
- Geographic-Demographic-Economic Characteristics
- access this document via http://proximityone.com/profiles/1/zip_1516_66224.htm
- access other ZIP Code profiles
- Updated: 04/09/18
Contents
This document is organized into these sections:
|
1.1. Overview & Updates 2.1. General Demographics 2.2. Social Characteristics 2.3. Economic Characteristics 2.4. Housing Characteristics 3.1. Business Establishments |
Situation & Outlook Terms of Use Statistical Release Dates Related Resources Using this Document Glossary |
1.1. Overview
The following graphic shows ZIP code 66224 with a bold red boundary. Census tracts are shown with black boundaries with tract codes as white labels. See more about ZIP-Tract relationships. In some graphics, cities/places are shown with blue cross-hatch pattern.
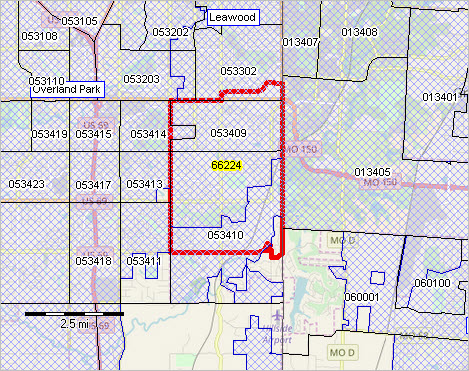
- view created with CV XE GIS software and related GIS project.
Selected Characteristics
| Item | Value |
| Census 2010 Population | 11,917 |
| Census 2010 Percent Urban Population | 99.81 |
| Land area | 7.0 square miles |
| Census 2010 Population Density | 1,731 persons per square mile |
| Internal latitude-longitude point | 38.863539, -94.626804 |
| Census 2010 state, county, tract, census block | 20-091-053410-4011 |
| City/Place | Overland Park |
| County | Johnson County, KS (20091) |
| Metro/CBSA | Kansas City, MO-KS MSA (28140) |
| Housing Price Index 2014 (see HPI notes) | 193.19 .. %change from 2013 ... 4.53 |
| .. HPI 2015 | 212.41 .. %change from 2014 ... 9.94 |
| .. HPI 2016 | 209.35 .. %change from 2015 ... -1.44 |
| Business Establishments 2015 (see ZBP notes) | 285 |
| .. Business Establishments Employment, 2015 | 1,797 |
| .. Business Establishments Payroll, 2015 | $93,947,000 .. annual pay per employee $52,280 |
Five Year Change
| Item | 2009 (ACS2011) | 2014 (ACS2016) | Change | % Change |
| Population | 11,611 | 13,183 | 1,572 | 13.54 |
| Housing Units | 3,823 | 4,517 | 694 | 18.15 |
| Occupied Units | 3,644 | 4,358 | 714 | 19.59 |
| Vacant Units | 179 | 159 | -20 | -11.17 |
| Gini Index of Income Inequality | 0.4222 | 0.4985 | 0.0763 | 18.0720 |
| Median Household Income | $141,189 | $147,717 | $6,528 | 4.62 |
| Median Housing Value | $418,800 | $436,900 | $18,100 | 4.32 |
| Median Rent | $897 | $990 | $93 | 10.37 |
2.1. General Demographic Characteristics - goto top
- based on Census American Community Survey 5-year estimates; ACS 2015 and ACS 2016.
- view/compare this area to other areas using demographic characteristics interactive table.
| Item | 2013 (ACS2015) | 2014 (ACS2016) | Change | % Change |
| GENDER AND AGE | ||||
| Total population | 12,714 | 13,183 | 469 | 3.7 |
| Male | 6,638 | 6,914 | 276 | 4.2 |
| Female | 6,076 | 6,269 | 193 | 3.2 |
| Under 5 years | 602 | 639 | 37 | 6.1 |
| 5 to 9 years | 1,458 | 1,468 | 10 | 0.7 |
| 10 to 14 years | 1,654 | 1,652 | -2 | -0.1 |
| 15 to 19 years | 947 | 986 | 39 | 4.1 |
| 20 to 24 years | 310 | 356 | 46 | 14.8 |
| 25 to 34 years | 630 | 702 | 72 | 11.4 |
| 35 to 44 years | 2,033 | 1,845 | -188 | -9.2 |
| 45 to 54 years | 2,382 | 2,642 | 260 | 10.9 |
| 55 to 59 years | 937 | 948 | 11 | 1.2 |
| 60 to 64 years | 516 | 673 | 157 | 30.4 |
| 65 to 74 years | 818 | 867 | 49 | 6.0 |
| 75 to 84 years | 366 | 296 | -70 | -19.1 |
| 85 years and over | 61 | 109 | 48 | 78.7 |
| Median age (years) | 39.6 | 39.7 | 0.1 | 0.3 |
| 18 years and over | 8,352 | 8,771 | 419 | 5.0 |
| 21 years and over | 7,967 | 8,348 | 381 | 4.8 |
| 62 years and over | 1,527 | 1,643 | 116 | 7.6 |
| 65 years and over | 1,245 | 1,272 | 27 | 2.2 |
| 18 years and over | 8,352 | 8,771 | 419 | 5.0 |
| Male | 4,076 | 4,297 | 221 | 5.4 |
| Female | 4,276 | 4,474 | 198 | 4.6 |
| 65 years and over | 1,245 | 1,272 | 27 | 2.2 |
| Male | 616 | 643 | 27 | 4.4 |
| Female | 629 | 629 | 0 | 0.0 |
| RACE | ||||
| Total population | 12,714 | 13,183 | 469 | 3.7 |
| One race | 12,314 | 12,773 | 459 | 3.7 |
| Two or more races | 400 | 410 | 10 | 2.5 |
| One race | 12,314 | 12,773 | 459 | 3.7 |
| White | 10,630 | 11,083 | 453 | 4.3 |
| Black or African American | 480 | 339 | -141 | -29.4 |
| American Indian and Alaska Native | 9 | 16 | 7 | 77.8 |
| Cherokee tribal grouping | 0 | 0 | 0 | ... |
| Chippewa tribal grouping | 0 | 0 | 0 | ... |
| Navajo tribal grouping | 0 | 0 | 0 | ... |
| Sioux tribal grouping | 0 | 0 | 0 | ... |
| Asian | 1,191 | 1,329 | 138 | 11.6 |
| Asian Indian | 714 | 868 | 154 | 21.6 |
| Chinese | 166 | 152 | -14 | -8.4 |
| Filipino | 35 | 39 | 4 | 11.4 |
| Japanese | 6 | 10 | 4 | 66.7 |
| Korean | 59 | 54 | -5 | -8.5 |
| Vietnamese | 0 | 13 | 13 | ... |
| Other Asian | 211 | 193 | -18 | -8.5 |
| Native Hawaiian and Other Pacific Islander | 4 | 6 | 2 | 50.0 |
| Native Hawaiian | 0 | 0 | 0 | ... |
| Guamanian or Chamorro | 0 | 0 | 0 | ... |
| Samoan | 0 | 0 | 0 | ... |
| Other Pacific Islander | 4 | 6 | 2 | 50.0 |
| Some other race | 0 | 0 | 0 | ... |
| Two or more races | 400 | 410 | 10 | 2.5 |
| White and Black or African American | 10 | 10 | 0 | 0.0 |
| White and American Indian and Alaska Native | 134 | 129 | -5 | -3.7 |
| White and Asian | 249 | 258 | 9 | 3.6 |
| Black or African American and American Indian and Alaska Native | 0 | 0 | 0 | ... |
| Race alone or in combination with one or more other races | ||||
| Total population | 12,714 | 13,183 | 469 | 3.7 |
| White | 11,023 | 11,480 | 457 | 4.1 |
| Black or African American | 1,447 | 349 | -1,098 | -75.9 |
| American Indian and Alaska Native | 0 | 145 | 145 | ... |
| Asian | 0 | 1,600 | 1,600 | ... |
| Native Hawaiian and Other Pacific Islander | 11 | 19 | 8 | 72.7 |
| Some other race | 0 | 0 | 0 | ... |
| HISPANIC OR LATINO AND RACE | ||||
| Total population | 12,714 | 13,183 | 469 | 3.7 |
| Hispanic or Latino (of any race) | 284 | 399 | 115 | 40.5 |
| Mexican | 53 | 56 | 3 | 5.7 |
| Puerto Rican | 78 | 83 | 5 | 6.4 |
| Cuban | 67 | 67 | 0 | 0.0 |
| Other Hispanic or Latino | 86 | 193 | 107 | 124.4 |
| Not Hispanic or Latino | 12,430 | 12,784 | 354 | 2.8 |
| White alone | 10,346 | 10,684 | 338 | 3.3 |
| Black or African American alone | 480 | 339 | -141 | -29.4 |
| American Indian and Alaska Native alone | 9 | 16 | 7 | 77.8 |
| Asian alone | 1,191 | 1,329 | 138 | 11.6 |
| Native Hawaiian and Other Pacific Islander alone | 4 | 6 | 2 | 50.0 |
| Some other race alone | 0 | 0 | 0 | ... |
| Two or more races | 400 | 410 | 10 | 2.5 |
| Two races including Some other race | 0 | 0 | 0 | ... |
| Two races excluding Some other race, and Three or more races | 400 | 410 | 10 | 2.5 |
| Total housing units | 4,194 | 4,517 | 323 | 7.7 |
| CITIZEN, VOTING AGE POPULATION | ||||
| Citizen, 18 and over population | 7,935 | 8,311 | 376 | 4.7 |
| Male | 3,885 | 4,098 | 213 | 5.5 |
| Female | 4,050 | 4,213 | 163 | 4.0 |
- based on Census American Community Survey 5-year estimates; ACS 2015 and ACS 2016
- view/compare this area to other areas using social characteristics interactive table.
| Item | 2013 (ACS2015) | 2014 (ACS2016) | Change | % Change |
| HOUSEHOLDS BY TYPE | ||||
| Total households | 4,048 | 4,358 | 310 | 7.7 |
| Family households (families) | 3,604 | 3,744 | 140 | 3.9 |
| With own children of the householder under 18 years | 2,098 | 2,121 | 23 | 1.1 |
| Married-couple family | 3,299 | 3,425 | 126 | 3.8 |
| With own children of the householder under 18 years | 1,875 | 1,913 | 38 | 2.0 |
| Male householder, no wife present, family | 68 | 41 | -27 | -39.7 |
| With own children of the householder under 18 years | 61 | 30 | -31 | -50.8 |
| Female householder, no husband present, family | 237 | 278 | 41 | 17.3 |
| With own children of the householder under 18 years | 162 | 178 | 16 | 9.9 |
| Nonfamily households | 444 | 614 | 170 | 38.3 |
| Householder living alone | 392 | 547 | 155 | 39.5 |
| 65 years and over | 213 | 244 | 31 | 14.6 |
| Households with one or more people under 18 years | 2,121 | 2,170 | 49 | 2.3 |
| Households with one or more people 65 years and over | 832 | 872 | 40 | 4.8 |
| Average household size | 3.14 | 3.03 | -0.11 | -3.5 |
| Average family size | 3.37 | 3.32 | -0.05 | -1.5 |
| RELATIONSHIP | ||||
| Population in households | 12,714 | 13,183 | 469 | 3.7 |
| Householder | 4,048 | 4,358 | 310 | 7.7 |
| Spouse | 3,317 | 3,400 | 83 | 2.5 |
| Child | 4,958 | 5,038 | 80 | 1.6 |
| Other relatives | 284 | 258 | -26 | -9.2 |
| Nonrelatives | 107 | 129 | 22 | 20.6 |
| Unmarried partner | 67 | 74 | 7 | 10.4 |
| MARITAL STATUS | ||||
| Males 15 years and over | 4,513 | 4,731 | 218 | 4.8 |
| Never married | 967 | 1,029 | 62 | 6.4 |
| Now married, except separated | 3,383 | 3,487 | 104 | 3.1 |
| Separated | 0 | 9 | 9 | ... |
| Widowed | 67 | 81 | 14 | 20.9 |
| Divorced | 96 | 125 | 29 | 30.2 |
| Females 15 years and over | 4,487 | 4,693 | 206 | 4.6 |
| Never married | 574 | 723 | 149 | 26.0 |
| Now married, except separated | 3,378 | 3,458 | 80 | 2.4 |
| Separated | 25 | 26 | 1 | 4.0 |
| Widowed | 160 | 144 | -16 | -10.0 |
| Divorced | 350 | 342 | -8 | -2.3 |
| FERTILITY | ||||
| Number of women 15 to 50 years old who had a birth in the past 12 months | 128 | 110 | -18 | -14.1 |
| Unmarried women (widowed, divorced, and never married) | 0 | 0 | 0 | ... |
| Per 1,000 unmarried women | 0 | 0 | 0 | ... |
| Per 1,000 women 15 to 50 years old | 48 | 40 | -8 | -16.7 |
| Per 1,000 women 15 to 19 years old | 0 | 0 | 0 | ... |
| Per 1,000 women 20 to 34 years old | 224 | 216 | -8 | -3.6 |
| Per 1,000 women 35 to 50 years old | 16 | 0 | -16 | -100.0 |
| GRANDPARENTS | ||||
| Number of grandparents living with own grandchildren under 18 years | 172 | 174 | 2 | 1.2 |
| Grandparents responsible for grandchildren | 80 | 83 | 3 | 3.8 |
| Years responsible for grandchildren | ||||
| Less than 1 year | 0 | 0 | 0 | ... |
| 1 or 2 years | 49 | 45 | -4 | -8.2 |
| 3 or 4 years | 0 | 0 | 0 | ... |
| 5 or more years | 31 | 38 | 7 | 22.6 |
| Number of grandparents responsible for own grandchildren under 18 years | 80 | 83 | 3 | 3.8 |
| Who are female | 40 | 41 | 1 | 2.5 |
| Who are married | 80 | 83 | 3 | 3.8 |
| SCHOOL ENROLLMENT | ||||
| Population 3 years and over enrolled in school | 4,535 | 4,692 | 157 | 3.5 |
| Nursery school, preschool | 267 | 316 | 49 | 18.4 |
| Kindergarten | 197 | 161 | -36 | -18.3 |
| Elementary school (grades 1-8) | 2,650 | 2,649 | -1 | 0.0 |
| High school (grades 9-12) | 934 | 1,007 | 73 | 7.8 |
| College or graduate school | 487 | 559 | 72 | 14.8 |
| EDUCATIONAL ATTAINMENT | ||||
| Population 25 years and over | 7,743 | 8,082 | 339 | 4.4 |
| Less than 9th grade | 0 | 0 | 0 | ... |
| 9th to 12th grade, no diploma | 57 | 72 | 15 | 26.3 |
| High school graduate (includes equivalency) | 449 | 427 | -22 | -4.9 |
| Some college, no degree | 997 | 1,031 | 34 | 3.4 |
| Associate's degree | 369 | 444 | 75 | 20.3 |
| Bachelor's degree | 3,403 | 3,451 | 48 | 1.4 |
| Graduate or professional degree | 2,468 | 2,657 | 189 | 7.7 |
| Percent high school graduate or higher | 99.3 | 99.1 | -0.2 | -0.2 |
| Percent bachelor's degree or higher | 75.8 | 75.6 | -0.2 | -0.3 |
| VETERAN STATUS | ||||
| Civilian population 18 years and over | 8,334 | 8,771 | 437 | 5.2 |
| Civilian veterans | 401 | 418 | 17 | 4.2 |
| DISABILITY STATUS OF THE CIVILIAN NONINSTITUTIONALIZED POPULATION | ||||
| Total Civilian Noninstitutionalized Population | 12,696 | 13,183 | 487 | 3.8 |
| With a disability | 722 | 663 | -59 | -8.2 |
| Under 18 years | 4,362 | 4,412 | 50 | 1.1 |
| With a disability | 99 | 120 | 21 | 21.2 |
| 18 to 64 years | 7,089 | 7,499 | 410 | 5.8 |
| With a disability | 376 | 329 | -47 | -12.5 |
| 65 years and over | 1,245 | 1,272 | 27 | 2.2 |
| With a disability | 247 | 214 | -33 | -13.4 |
| RESIDENCE 1 YEAR AGO | ||||
| Population 1 year and over | 12,636 | 13,099 | 463 | 3.7 |
| Same house | 11,494 | 11,889 | 395 | 3.4 |
| Different house in the U.S. | 1,066 | 1,161 | 95 | 8.9 |
| Same county | 563 | 750 | 187 | 33.2 |
| Different county | 503 | 411 | -92 | -18.3 |
| Same state | 34 | 69 | 35 | 102.9 |
| Different state | 469 | 342 | -127 | -27.1 |
| Abroad | 76 | 49 | -27 | -35.5 |
| PLACE OF BIRTH | ||||
| Total population | 12,714 | 13,183 | 469 | 3.7 |
| Native | 11,506 | 11,810 | 304 | 2.6 |
| Born in United States | 11,408 | 11,706 | 298 | 2.6 |
| State of residence | 3,772 | 3,837 | 65 | 1.7 |
| Different state | 7,636 | 7,869 | 233 | 3.1 |
| Born in Puerto Rico, U.S. Island areas, or born abroad to American parent( | 98 | 104 | 6 | 6.1 |
| Foreign born | 1,208 | 1,373 | 165 | 13.7 |
| U.S. CITIZENSHIP STATUS | ||||
| Foreign-born population | 1,208 | 1,373 | 165 | 13.7 |
| Naturalized U.S. citizen | 696 | 814 | 118 | 17.0 |
| Not a U.S. citizen | 512 | 559 | 47 | 9.2 |
| YEAR OF ENTRY | ||||
| Population born outside the United States | 1,306 | 1,477 | 171 | 13.1 |
| Native | 98 | 104 | 6 | 6.1 |
| Entered 2010 or later | 0 | 0 | 0 | ... |
| Entered before 2010 | 98 | 104 | 6 | 6.1 |
| Foreign born | 1,208 | 1,373 | 165 | 13.7 |
| Entered 2010 or later | 68 | 93 | 25 | 36.8 |
| Entered before 2010 | 1,140 | 1,280 | 140 | 12.3 |
| WORLD REGION OF BIRTH OF FOREIGN BORN | ||||
| Foreign-born population, excluding population born at sea | 1,208 | 1,373 | 165 | 13.7 |
| Europe | 127 | 150 | 23 | 18.1 |
| Asia | 907 | 985 | 78 | 8.6 |
| Africa | 11 | 45 | 34 | 309.1 |
| Oceania | 0 | 0 | 0 | ... |
| Latin America | 98 | 152 | 54 | 55.1 |
| Northern America | 65 | 41 | -24 | -36.9 |
| LANGUAGE SPOKEN AT HOME | ||||
| Population 5 years and over | 12,112 | 12,544 | 432 | 3.6 |
| English only | 10,817 | 10,838 | 21 | 0.2 |
| Language other than English | 1,295 | 1,706 | 411 | 31.7 |
| Speak English less than "very well" | 216 | 314 | 98 | 45.4 |
| Spanish | 131 | 301 | 170 | 129.8 |
| Speak English less than "very well" | 30 | 31 | 1 | 3.3 |
| Other Indo-European languages | 612 | 623 | 11 | 1.8 |
| Speak English less than "very well" | 32 | 24 | -8 | -25.0 |
| Asian and Pacific Islander languages | 552 | 732 | 180 | 32.6 |
| Speak English less than "very well" | 154 | 249 | 95 | 61.7 |
| Other languages | 0 | 50 | 50 | ... |
| Speak English less than "very well" | 0 | 10 | 10 | ... |
| ANCESTRY | ||||
| Total population | 12,714 | 13,183 | 469 | 3.7 |
| American | 603 | 561 | -42 | -7.0 |
| Arab | 54 | 92 | 38 | 70.4 |
| Czech | 179 | 167 | -12 | -6.7 |
| Danish | 11 | 16 | 5 | 45.5 |
| Dutch | 156 | 145 | -11 | -7.1 |
| English | 1,761 | 1,844 | 83 | 4.7 |
| French (except Basque) | 208 | 273 | 65 | 31.3 |
| French Canadian | 30 | 31 | 1 | 3.3 |
| German | 4,030 | 4,163 | 133 | 3.3 |
| Greek | 20 | 25 | 5 | 25.0 |
| Hungarian | 92 | 74 | -18 | -19.6 |
| Irish | 1,941 | 2,418 | 477 | 24.6 |
| Italian | 887 | 911 | 24 | 2.7 |
| Lithuanian | 0 | 15 | 15 | ... |
| Norwegian | 243 | 173 | -70 | -28.8 |
| Polish | 145 | 167 | 22 | 15.2 |
| Portuguese | 41 | 41 | 0 | 0.0 |
| Russian | 108 | 96 | -12 | -11.1 |
| Scotch-Irish | 247 | 228 | -19 | -7.7 |
| Scottish | 388 | 352 | -36 | -9.3 |
| Slovak | 7 | 9 | 2 | 28.6 |
| Subsaharan African | 0 | 0 | 0 | ... |
| Swedish | 491 | 531 | 40 | 8.1 |
| Swiss | 62 | 62 | 0 | 0.0 |
| Ukrainian | 13 | 0 | -13 | -100.0 |
| Welsh | 291 | 212 | -79 | -27.1 |
| West Indian (excluding Hispanic origin groups) | 44 | 56 | 12 | 27.3 |
| COMPUTERS AND INTERNET USE | ||||
| Total households | -9 | -9 | 0 | 0.0 |
| With a computer | -9 | -9 | 0 | 0.0 |
| With a broadband Internet subscription | -9 | -9 | 0 | 0.0 |
- based on Census American Community Survey 5-year estimates; ACS 2015 and ACS 2016
- view/compare this area to other areas using economic characteristics interactive table.
| Item | 2013 (ACS2015) | 2014 (ACS2016) | Change | % Change |
| EMPLOYMENT STATUS | ||||
| Population 16 years and over | 8,688 | 9,121 | 433 | 5.0 |
| In labor force | 5,781 | 6,078 | 297 | 5.1 |
| Civilian labor force | 5,763 | 6,078 | 315 | 5.5 |
| Employed | 5,638 | 5,920 | 282 | 5.0 |
| Unemployed | 125 | 158 | 33 | 26.4 |
| Armed Forces | 18 | 0 | -18 | -100.0 |
| Not in labor force | 2,907 | 3,043 | 136 | 4.7 |
| Civilian labor force | 5,763 | 6,078 | 315 | 5.5 |
| Unemployment Rate | 2.2 | 2.6 | 0.4 | 18.2 |
| Females 16 years and over | 4,380 | 4,584 | 204 | 4.7 |
| In labor force | 2,340 | 2,559 | 219 | 9.4 |
| Civilian labor force | 2,340 | 2,559 | 219 | 9.4 |
| Employed | 2,281 | 2,455 | 174 | 7.6 |
| Own children of the householder under 6 years | 833 | 832 | -1 | -0.1 |
| All parents in family in labor force | 369 | 368 | -1 | -0.3 |
| Own children of the householder 6 to 17 years | 3,494 | 3,537 | 43 | 1.2 |
| All parents in family in labor force | 2,119 | 2,136 | 17 | 0.8 |
| COMMUTING TO WORK | ||||
| Workers 16 years and over | 5,626 | 5,920 | 294 | 5.2 |
| Car, truck, or van -- drove alone | 4,668 | 4,938 | 270 | 5.8 |
| Car, truck, or van -- carpooled | 281 | 224 | -57 | -20.3 |
| Public transportation (excluding taxicab) | 0 | 0 | 0 | ... |
| Walked | 46 | 22 | -24 | -52.2 |
| Other means | 16 | 17 | 1 | 6.3 |
| Worked at home | 615 | 719 | 104 | 16.9 |
| Mean travel time to work (minutes) | 22.4 | 23.6 | 1.2 | 5.4 |
| OCCUPATION | ||||
| Civilian employed population 16 years and over | 5,638 | 5,920 | 282 | 5.0 |
| Management, business, science, and arts occupations | 3,750 | 3,900 | 150 | 4.0 |
| Service occupations | 222 | 305 | 83 | 37.4 |
| Sales and office occupations | 1,411 | 1,429 | 18 | 1.3 |
| Natural resources, construction, and maintenance occupations | 114 | 122 | 8 | 7.0 |
| Production, transportation, and material moving occupations | 141 | 164 | 23 | 16.3 |
| INDUSTRY | ||||
| Civilian employed population 16 years and over | 5,638 | 5,920 | 282 | 5.0 |
| Agriculture, forestry, fishing and hunting, and mining | 6 | 8 | 2 | 33.3 |
| Construction | 139 | 141 | 2 | 1.4 |
| Manufacturing | 418 | 474 | 56 | 13.4 |
| Wholesale trade | 255 | 318 | 63 | 24.7 |
| Retail trade | 651 | 648 | -3 | -0.5 |
| Transportation and warehousing, and utilities | 236 | 253 | 17 | 7.2 |
| Information | 408 | 358 | -50 | -12.3 |
| Finance and insurance, and real estate and rental and leasing | 786 | 826 | 40 | 5.1 |
| Professional, scientific, and management, and administrative and waste man | 968 | 1,111 | 143 | 14.8 |
| Educational services, and health care and social assistance | 1,236 | 1,325 | 89 | 7.2 |
| Arts, entertainment, and recreation, and accommodation and food services | 191 | 248 | 57 | 29.8 |
| Other services, except public administration | 262 | 174 | -88 | -33.6 |
| Public administration | 82 | 36 | -46 | -56.1 |
| CLASS OF WORKER | ||||
| Civilian employed population 16 years and over | 5,638 | 5,920 | 282 | 5.0 |
| Private wage and salary workers | 4,927 | 5,153 | 226 | 4.6 |
| Government workers | 461 | 437 | -24 | -5.2 |
| Self-employed in own not incorporated business workers | 234 | 314 | 80 | 34.2 |
| Unpaid family workers | 16 | 16 | 0 | 0.0 |
| INCOME AND BENEFITS (IN 2015 INFLATION-ADJUSTED DOLLARS) | ||||
| Total households | 4,048 | 4,358 | 310 | 7.7 |
| Less than $10,000 | 89 | 116 | 27 | 30.3 |
| $10,000 to $14,999 | 69 | 95 | 26 | 37.7 |
| $15,000 to $24,999 | 111 | 169 | 58 | 52.3 |
| $25,000 to $34,999 | 212 | 298 | 86 | 40.6 |
| $35,000 to $49,999 | 177 | 162 | -15 | -8.5 |
| $50,000 to $74,999 | 299 | 273 | -26 | -8.7 |
| $75,000 to $99,999 | 373 | 344 | -29 | -7.8 |
| $100,000 to $149,999 | 694 | 743 | 49 | 7.1 |
| $150,000 to $199,999 | 712 | 651 | -61 | -8.6 |
| $200,000 or more | 1,312 | 1,507 | 195 | 14.9 |
| Median household income (dollars) | 150,000 | 147,717 | -2,283 | -1.5 |
| Mean household income (dollars) | 213,490 | 206,632 | -6,858 | -3.2 |
| With earnings | 3,668 | 3,863 | 195 | 5.3 |
| Mean earnings (dollars) | 209,503 | 207,027 | -2,476 | -1.2 |
| With Social Security | 823 | 881 | 58 | 7.0 |
| Mean Social Security income (dollars) | 25,521 | 25,668 | 147 | 0.6 |
| With retirement income | 480 | 514 | 34 | 7.1 |
| Mean retirement income (dollars) | 37,452 | 32,264 | -5,188 | -13.9 |
| With Supplemental Security Income | 28 | 42 | 14 | 50.0 |
| Mean Supplemental Security Income (dollars) | 11,736 | 11,390 | -346 | -2.9 |
| With cash public assistance income | 35 | 41 | 6 | 17.1 |
| Mean cash public assistance income (dollars) | -8 | -8 | 0 | 0.0 |
| With Food Stamp/SNAP benefits in the past 12 months | 41 | 56 | 15 | 36.6 |
| Families | 3,604 | 3,744 | 140 | 3.9 |
| Less than $10,000 | 62 | 98 | 36 | 58.1 |
| $10,000 to $14,999 | 20 | 17 | -3 | -15.0 |
| $15,000 to $24,999 | 88 | 73 | -15 | -17.0 |
| $25,000 to $34,999 | 80 | 100 | 20 | 25.0 |
| $35,000 to $49,999 | 113 | 128 | 15 | 13.3 |
| $50,000 to $74,999 | 270 | 201 | -69 | -25.6 |
| $75,000 to $99,999 | 358 | 317 | -41 | -11.5 |
| $100,000 to $149,999 | 628 | 693 | 65 | 10.4 |
| $150,000 to $199,999 | 692 | 636 | -56 | -8.1 |
| $200,000 or more | 1,293 | 1,481 | 188 | 14.5 |
| Median family income (dollars) | 160,119 | 162,225 | 2,106 | 1.3 |
| Mean family income (dollars) | 232,431 | 232,125 | -306 | -0.1 |
| Per capita income (dollars) | 68,553 | 68,589 | 36 | 0.1 |
| Nonfamily households | 444 | 614 | 170 | 38.3 |
| Median nonfamily income (dollars) | 33,676 | 30,505 | -3,171 | -9.4 |
| Mean nonfamily income (dollars) | 51,325 | 45,971 | -5,354 | -10.4 |
| Median earnings for workers (dollars) | 74,158 | 71,844 | -2,314 | -3.1 |
| Median earnings for male full-time, year-round workers (dollars) | 122,768 | 123,696 | 928 | 0.8 |
| Median earnings for female full-time, year-round workers (dollars) | 58,487 | 66,906 | 8,419 | 14.4 |
| HEALTH INSURANCE COVERAGE | ||||
| Civilian noninstitutionalized population | 12,696 | 13,183 | 487 | 3.8 |
| With health insurance coverage | 12,492 | 13,043 | 551 | 4.4 |
| With private health insurance | 11,728 | 12,197 | 469 | 4.0 |
| With public coverage | 1,530 | 1,589 | 59 | 3.9 |
| No health insurance coverage | 204 | 140 | -64 | -31.4 |
| Civilian noninstitutionalized population under 18 years | 4,362 | 4,412 | 50 | 1.1 |
| No health insurance coverage | 33 | 14 | -19 | -57.6 |
| Civilian noninstitutionalized population 18 to 64 years | 7,089 | 7,499 | 410 | 5.8 |
| In labor force: | 5,273 | 5,609 | 336 | 6.4 |
| Employed: | 5,154 | 5,451 | 297 | 5.8 |
| With health insurance coverage | 5,071 | 5,358 | 287 | 5.7 |
| With private health insurance | 5,004 | 5,317 | 313 | 6.3 |
| With public coverage | 76 | 80 | 4 | 5.3 |
| No health insurance coverage | 83 | 93 | 10 | 12.0 |
| Unemployed: | 119 | 158 | 39 | 32.8 |
| With health insurance coverage | 113 | 148 | 35 | 31.0 |
| With private health insurance | 89 | 118 | 29 | 32.6 |
| With public coverage | 24 | 30 | 6 | 25.0 |
| No health insurance coverage | 6 | 10 | 4 | 66.7 |
| Not in labor force: | 1,816 | 1,890 | 74 | 4.1 |
| With health insurance coverage | 1,746 | 1,876 | 130 | 7.4 |
| With private health insurance | 1,688 | 1,831 | 143 | 8.5 |
| With public coverage | 96 | 101 | 5 | 5.2 |
| No health insurance coverage | 70 | 14 | -56 | -80.0 |
| Percent Families & People with Income in Past 12 Months Below Poverty Leve | ||||
| All families | 3.2 | 4.2 | 1.0 | 31.2 |
| With related children of the householder under 18 years | 4.2 | 4.1 | -0.1 | -2.4 |
| With related children of the householder under 5 years only | 0.0 | 0.0 | 0.0 | ... |
| Married couple families | 1.4 | 2.5 | 1.1 | 78.6 |
| With related children of the householder under 18 years | 1.1 | 0.9 | -0.2 | -18.2 |
| With related children of the householder under 5 years only | 0.0 | 0.0 | 0.0 | ... |
| Families with female householder, no husband present | 29.5 | 25.9 | -3.6 | -12.2 |
| With related children of the householder under 18 years | 43.2 | 37.7 | -5.5 | -12.7 |
| With related children of the householder under 5 years only | -1.0 | 0.0 | 1.0 | -100.0 |
| All people | 3.5 | 3.8 | 0.3 | 8.6 |
| Under 18 years | 4.6 | 4.0 | -0.6 | -13.0 |
| Related children of the householder under 18 years | 4.6 | 4.0 | -0.6 | -13.0 |
| Related children of the householder under 5 years | 3.3 | 2.8 | -0.5 | -15.2 |
| Related children of the householder 5 to 17 years | 4.8 | 4.2 | -0.6 | -12.5 |
| 18 years and over | 2.9 | 3.7 | 0.8 | 27.6 |
| 18 to 64 years | 2.7 | 3.8 | 1.1 | 40.7 |
| 65 years and over | 4.0 | 2.8 | -1.2 | -30.0 |
| People in families | 3.3 | 3.6 | 0.3 | 9.1 |
| Unrelated individuals 15 years and over | 8.5 | 7.1 | -1.4 | -16.5 |
- based on Census American Community Survey 5-year estimates; ACS 2015 and ACS 2016
- view/compare this area to other areas using housing characteristics interactive table.
| Item | 2013 (ACS2015) | 2014 (ACS2016) | Change | % Change |
| HOUSING OCCUPANCY | ||||
| Total housing units | 4,194 | 4,517 | 323 | 7.7 |
| Occupied housing units | 4,048 | 4,358 | 310 | 7.7 |
| Vacant housing units | 146 | 159 | 13 | 8.9 |
| Homeowner vacancy rate | 1.2 | 1.3 | 0.1 | 8.3 |
| Rental vacancy rate | 6.1 | 5.5 | -0.6 | -9.8 |
| UNITS IN STRUCTURE | ||||
| Total housing units | 4,194 | 4,517 | 323 | 7.7 |
| 1-unit, detached | 3,705 | 3,963 | 258 | 7.0 |
| 1-unit, attached | 189 | 174 | -15 | -7.9 |
| 2 units | 11 | 13 | 2 | 18.2 |
| 3 or 4 units | 50 | 40 | -10 | -20.0 |
| 5 to 9 units | 126 | 166 | 40 | 31.7 |
| 10 to 19 units | 92 | 105 | 13 | 14.1 |
| 20 or more units | 21 | 56 | 35 | 166.7 |
| Mobile home | 0 | 0 | 0 | ... |
| Boat, RV, van, etc. | 0 | 0 | 0 | ... |
| YEAR STRUCTURE BUILT | ||||
| Total housing units | 4,194 | 4,517 | 323 | 7.7 |
| Built 2014 or later | 18 | 84 | 66 | 366.7 |
| Built 2010 to 2013 | 159 | 219 | 60 | 37.7 |
| Built 2000 to 2009 | 1,884 | 1,885 | 1 | 0.1 |
| Built 1990 to 1999 | 1,578 | 1,771 | 193 | 12.2 |
| Built 1980 to 1989 | 295 | 275 | -20 | -6.8 |
| Built 1970 to 1979 | 189 | 199 | 10 | 5.3 |
| Built 1960 to 1969 | 19 | 17 | -2 | -10.5 |
| Built 1950 to 1959 | 14 | 13 | -1 | -7.1 |
| Built 1940 to 1949 | 34 | 33 | -1 | -2.9 |
| Built 1939 or earlier | 4 | 21 | 17 | 425.0 |
| ROOMS | ||||
| Total housing units | 4,194 | 4,517 | 323 | 7.7 |
| 1 room | 0 | 0 | 0 | ... |
| 2 rooms | 35 | 73 | 38 | 108.6 |
| 3 rooms | 86 | 137 | 51 | 59.3 |
| 4 rooms | 105 | 161 | 56 | 53.3 |
| 5 rooms | 265 | 184 | -81 | -30.6 |
| 6 rooms | 217 | 149 | -68 | -31.3 |
| 7 rooms | 369 | 386 | 17 | 4.6 |
| 8 rooms | 785 | 789 | 4 | 0.5 |
| 9 rooms or more | 2,332 | 2,638 | 306 | 13.1 |
| Median rooms | 9.0 | 9.0 | 0.0 | 0.0 |
| BEDROOMS | ||||
| Total housing units | 4,194 | 4,517 | 323 | 7.7 |
| No bedroom | 0 | 0 | 0 | ... |
| 1 bedroom | 75 | 141 | 66 | 88.0 |
| 2 bedrooms | 309 | 380 | 71 | 23.0 |
| 3 bedrooms | 606 | 488 | -118 | -19.5 |
| 4 bedrooms | 2,216 | 2,249 | 33 | 1.5 |
| 5 or more bedrooms | 988 | 1,259 | 271 | 27.4 |
| HOUSING TENURE | ||||
| Occupied housing units | 4,048 | 4,358 | 310 | 7.7 |
| Owner-occupied | 3,754 | 3,946 | 192 | 5.1 |
| Renter-occupied | 294 | 412 | 118 | 40.1 |
| Average household size of owner-occupied unit | 3.21 | 3.11 | -0.10 | -3.1 |
| Average household size of renter-occupied unit | 2.30 | 2.20 | -0.10 | -4.3 |
| YEAR HOUSEHOLDER MOVED INTO UNIT | ||||
| Occupied housing units | 4,048 | 4,358 | 310 | 7.7 |
| Moved in 2015 or later | 48 | 295 | 247 | 514.6 |
| Moved in 2010 to 2014 | 995 | 1,079 | 84 | 8.4 |
| Moved in 2000 to 2009 | 2,221 | 2,262 | 41 | 1.8 |
| Moved in 1990 to 1999 | 708 | 656 | -52 | -7.3 |
| Moved in 1980 to 1989 | 58 | 50 | -8 | -13.8 |
| Moved in 1979 and earlier | 18 | 16 | -2 | -11.1 |
| VEHICLES AVAILABLE | ||||
| Occupied housing units | 4,048 | 4,358 | 310 | 7.7 |
| No vehicles available | 97 | 133 | 36 | 37.1 |
| 1 vehicle available | 616 | 670 | 54 | 8.8 |
| 2 vehicles available | 2,279 | 2,503 | 224 | 9.8 |
| 3 or more vehicles available | 1,056 | 1,052 | -4 | -0.4 |
| HOUSE HEATING FUEL | ||||
| Occupied housing units | 4,048 | 4,358 | 310 | 7.7 |
| Utility gas | 3,189 | 3,547 | 358 | 11.2 |
| Bottled, tank, or LP gas | 62 | 78 | 16 | 25.8 |
| Electricity | 773 | 718 | -55 | -7.1 |
| Fuel oil, kerosene, etc. | 0 | 0 | 0 | ... |
| Coal or coke | 0 | 0 | 0 | ... |
| Wood | 0 | 0 | 0 | ... |
| Solar energy | 0 | 0 | 0 | ... |
| Other fuel | 24 | 15 | -9 | -37.5 |
| No fuel used | 0 | 0 | 0 | ... |
| SELECTED CHARACTERISTICS | ||||
| Occupied housing units | 4,048 | 4,358 | 310 | 7.7 |
| Lacking complete plumbing facilities | 0 | 0 | 0 | ... |
| Lacking complete kitchen facilities | 21 | 56 | 35 | 166.7 |
| No telephone service available | 24 | 89 | 65 | 270.8 |
| OCCUPANTS PER ROOM | ||||
| Occupied housing units | 4,048 | 4,358 | 310 | 7.7 |
| 1.00 or less | 4,041 | 4,351 | 310 | 7.7 |
| 1.01 to 1.50 | 7 | 7 | 0 | 0.0 |
| 1.51 or more | 0 | 0 | 0 | ... |
| VALUE | ||||
| Owner-occupied units | 3,754 | 3,946 | 192 | 5.1 |
| Less than $50,000 | 26 | 28 | 2 | 7.7 |
| $50,000 to $99,999 | 0 | 0 | 0 | ... |
| $100,000 to $149,999 | 90 | 65 | -25 | -27.8 |
| $150,000 to $199,999 | 142 | 171 | 29 | 20.4 |
| $200,000 to $299,999 | 556 | 497 | -59 | -10.6 |
| $300,000 to $499,999 | 1,560 | 1,679 | 119 | 7.6 |
| $500,000 to $999,999 | 1,188 | 1,332 | 144 | 12.1 |
| $1,000,000 or more | 192 | 174 | -18 | -9.4 |
| Median (dollars) | 427,200 | 436,900 | 9,700 | 2.3 |
| MORTGAGE STATUS | ||||
| Owner-occupied units | 3,754 | 3,946 | 192 | 5.1 |
| Housing units with a mortgage | 2,787 | 2,912 | 125 | 4.5 |
| Housing units without a mortgage | 967 | 1,034 | 67 | 6.9 |
| SELECTED MONTHLY OWNER COSTS (SMOC) | ||||
| Housing units with a mortgage | 2,787 | 2,912 | 125 | 4.5 |
| Less than $500 | 5 | 5 | 0 | 0.0 |
| $500 to $999 | 35 | 34 | -1 | -2.9 |
| $1,000 to $1,499 | 60 | 84 | 24 | 40.0 |
| $1,500 to $1,999 | 365 | 474 | 109 | 29.9 |
| $2,000 to $2,499 | 599 | 567 | -32 | -5.3 |
| $2,500 to $2,999 | 544 | 580 | 36 | 6.6 |
| $3,000 or more | 1,179 | 1,168 | -11 | -0.9 |
| Median (dollars) | 2,803 | 2,752 | -51 | -1.8 |
| Housing units without a mortgage | 967 | 1,034 | 67 | 6.9 |
| Less than $250 | 4 | 6 | 2 | 50.0 |
| $250 to $399 | 13 | 16 | 3 | 23.1 |
| $400 to $599 | 76 | 79 | 3 | 3.9 |
| $600 to $799 | 233 | 264 | 31 | 13.3 |
| $800 to $999 | 165 | 170 | 5 | 3.0 |
| $1,000 or more | 476 | 499 | 23 | 4.8 |
| Median (dollars) | 975 | 983 | 8 | 0.8 |
| Monthly Owner Costs as Percent of Household Income (SMOCAPI) | ||||
| Housing units with a mortgage (excluding units where SMOCAPI cannot be com | 2,765 | 2,884 | 119 | 4.3 |
| Less than 20.0 percent | 1,440 | 1,664 | 224 | 15.6 |
| 20.0 to 24.9 percent | 284 | 246 | -38 | -13.4 |
| 25.0 to 29.9 percent | 331 | 326 | -5 | -1.5 |
| 30.0 to 34.9 percent | 218 | 191 | -27 | -12.4 |
| 35.0 percent or more | 492 | 457 | -35 | -7.1 |
| Not computed | 22 | 28 | 6 | 27.3 |
| Housing unit without a mortgage (excl units where SMOCAPI cannot be comput | 967 | 1,034 | 67 | 6.9 |
| Less than 10.0 percent | 500 | 518 | 18 | 3.6 |
| 10.0 to 14.9 percent | 128 | 134 | 6 | 4.7 |
| 15.0 to 19.9 percent | 38 | 47 | 9 | 23.7 |
| 20.0 to 24.9 percent | 49 | 49 | 0 | 0.0 |
| 25.0 to 29.9 percent | 68 | 78 | 10 | 14.7 |
| 30.0 to 34.9 percent | 32 | 30 | -2 | -6.3 |
| 35.0 percent or more | 152 | 178 | 26 | 17.1 |
| Not computed | 0 | 0 | 0 | ... |
| GROSS RENT | ||||
| Occupied units paying rent | 294 | 394 | 100 | 34.0 |
| Less than $500 | 6 | 0 | -6 | -100.0 |
| $500 to $999 | 147 | 209 | 62 | 42.2 |
| $1,000 to $1,499 | 99 | 123 | 24 | 24.2 |
| $1,500 to $1,999 | 11 | 34 | 23 | 209.1 |
| $2,000 to $2,499 | 24 | 21 | -3 | -12.5 |
| $2,500 to $2,999 | 0 | 0 | 0 | ... |
| $3,000 or more | 7 | 7 | 0 | 0.0 |
| Median (dollars) | 992 | 990 | -2 | -0.2 |
| No rent paid | 0 | 18 | 18 | ... |
| Gross Rent as Percent of Household Income (GRAPI) | ||||
| Occupied units paying rent (excluding units where GRAPI cannot be computed | 270 | 373 | 103 | 38.1 |
| Less than 15.0 percent | 38 | 55 | 17 | 44.7 |
| 15.0 to 19.9 percent | 0 | 0 | 0 | ... |
| 20.0 to 24.9 percent | 25 | 50 | 25 | 100.0 |
| 25.0 to 29.9 percent | 24 | 0 | -24 | -100.0 |
| 30.0 to 34.9 percent | 61 | 73 | 12 | 19.7 |
| 35.0 percent or more | 122 | 195 | 73 | 59.8 |
| Not computed | 24 | 39 | 15 | 62.5 |
3.1. Business Establishment Characteristics - goto top
- based on Census ZIP Business Patterns ZBP ... see usage notes below
- view/compare this area to other areas using business establishments interactive table.
- this section expands to include 2016 data in May 2018.
| Industry | 2015 Establishments | 2016 Establishments | Change | % Change |
| ------ Total for all sectors | 285 | ... | ... | ... |
| 23---- Construction | 17 | ... | ... | ... |
| 236/// Construction of Buildings | 8 | ... | ... | ... |
| 238/// Specialty Trade Contractors | 9 | ... | ... | ... |
| 42---- Wholesale Trade | 24 | ... | ... | ... |
| 423/// Merchant Wholesalers, Durable Goods | 7 | ... | ... | ... |
| 424/// Merchant Wholesalers, Nondurable Goods | 5 | ... | ... | ... |
| 425/// Wholesale Electronic Markets and Agents and Brokers | 12 | ... | ... | ... |
| 44---- Retail Trade | 18 | ... | ... | ... |
| 442/// Furniture and Home Furnishings Stores | 3 | ... | ... | ... |
| 445/// Food and Beverage Stores | 4 | ... | ... | ... |
| 446/// Health and Personal Care Stores | 2 | ... | ... | ... |
| 447/// Gasoline Stations | 1 | ... | ... | ... |
| 448/// Clothing and Clothing Accessories Stores | 4 | ... | ... | ... |
| 453/// Miscellaneous Store Retailers | 2 | ... | ... | ... |
| 454/// Nonstore Retailers | 2 | ... | ... | ... |
| 48---- Transportation and Warehousing | 2 | ... | ... | ... |
| 488/// Support Activities for Transportation | 2 | ... | ... | ... |
| 51---- Information | 3 | ... | ... | ... |
| 519/// Other Information Services | 3 | ... | ... | ... |
| 52---- Finance and Insurance | 38 | ... | ... | ... |
| 522/// Credit Intermediation and Related Activities | 9 | ... | ... | ... |
| 523/// Securities, Commodity Contracts, and Other Financial Investm | 16 | ... | ... | ... |
| 524/// Insurance Carriers and Related Activities | 13 | ... | ... | ... |
| 53---- Real Estate and Rental and Leasing | 23 | ... | ... | ... |
| 531/// Real Estate | 23 | ... | ... | ... |
| 54---- Professional, Scientific, and Technical Services | 69 | ... | ... | ... |
| 541/// Professional, Scientific, and Technical Services | 69 | ... | ... | ... |
| 55---- Management of Companies and Enterprises | 3 | ... | ... | ... |
| 551/// Management of Companies and Enterprises | 3 | ... | ... | ... |
| 56---- Administrative and Support and Waste Management and Remediat | 20 | ... | ... | ... |
| 561/// Administrative and Support Services | 19 | ... | ... | ... |
| 562/// Waste Management and Remediation Services | 1 | ... | ... | ... |
| 61---- Educational Services | 4 | ... | ... | ... |
| 611/// Educational Services | 4 | ... | ... | ... |
| 62---- Health Care and Social Assistance | 31 | ... | ... | ... |
| 621/// Ambulatory Health Care Services | 27 | ... | ... | ... |
| 6211// Offices of Physicians | 16 | ... | ... | ... |
| 62111/ Offices of Physicians | 16 | ... | ... | ... |
| 621111 Offices of Physicians (except Mental Health Specialists) | 14 | ... | ... | ... |
| 621112 Offices of Physicians, Mental Health Specialists | 2 | ... | ... | ... |
| 6212// Offices of Dentists | 6 | ... | ... | ... |
| 62121/ Offices of Dentists | 6 | ... | ... | ... |
| 6213// Offices of Other Health Practitioners | 2 | ... | ... | ... |
| 62131/ Offices of Chiropractors | 1 | ... | ... | ... |
| 62132/ Offices of Optometrists | 1 | ... | ... | ... |
| 6214// Outpatient Care Centers | 1 | ... | ... | ... |
| 62149/ Other Outpatient Care Centers | 1 | ... | ... | ... |
| 621493 Freestanding Ambulatory Surgical and Emergency Centers | 1 | ... | ... | ... |
| 6215// Medical and Diagnostic Laboratories | 2 | ... | ... | ... |
| 62151/ Medical and Diagnostic Laboratories | 2 | ... | ... | ... |
| 621511 Medical Laboratories | 2 | ... | ... | ... |
| 624/// Social Assistance | 4 | ... | ... | ... |
| 6241// Individual and Family Services | 1 | ... | ... | ... |
| 62419/ Other Individual and Family Services | 1 | ... | ... | ... |
| 6244// Child Day Care Services | 3 | ... | ... | ... |
| 62441/ Child Day Care Services | 3 | ... | ... | ... |
| 71---- Arts, Entertainment, and Recreation | 2 | ... | ... | ... |
| 711/// Performing Arts, Spectator Sports, and Related Industries | 1 | ... | ... | ... |
| 713/// Amusement, Gambling, and Recreation Industries | 1 | ... | ... | ... |
| 72---- Accommodation and Food Services | 11 | ... | ... | ... |
| 722/// Food Services and Drinking Places | 11 | ... | ... | ... |
| 81---- Other Services (except Public Administration) | 20 | ... | ... | ... |
| 811/// Repair and Maintenance | 4 | ... | ... | ... |
| 812/// Personal and Laundry Services | 13 | ... | ... | ... |
| 813/// Religious, Grantmaking, Civic, Professional, and Similar Org | 3 | ... | ... | ... |
Source: ProximityOne and Census Bureau.
Notes:
negative values in 2015, 2016 data columns indicate data not available.
Terms of Use
This document is a proprietary resource developed by ProximityOne and is licensed to the subscriber/licensee for their own use. This document may be used in any manner except that it may not be distributed whole or in part. Any use of the document should reference the source as ProximityOne and the Census Bureau and include a link to the S&O Main Page. There is no warranty of any type associated with any aspect of this report. The user of this document is solely responsible to any use, direct or indirect, that might be made of this document.
Using this Document ... goto top
This document to provides data and informaiton to assess geographic, demographic, economic characteristics and trends for this area. There are several aspects important to effective use of this document.
Accessing and Consuming the Data. The HTML document is designed for use with any browser using a tablet, laptop or desktop. The nature of the material is not intended for optimal use via cellphone.
ACS Survey-based Estimates. All ACS estimates are subject to errors of estimation and other sources of error. The 2015 and 2016 data are based on 5-year estimates. The ACS 2015 data are centric to mid 2013. The ACS 2016 data are centric to mid 2014. Change columns, 2015-16 are not recommended for use to measure annual change.
ACS Data Values & Top-coding.
- ACS 2015 median housing value is top-coded at $1,000,000
- ACS 2016 median housing value is top-coded at $2,000,000
Negative values appearing in the data columns 2015 and 2016 indicate data not available. Note that a value of zero appearing in the data columns 2015 and 2016 may not in actuality be zero; as described above, these are estimates based on survey respondent data.
Housing Price Index Notes. The Housing Price Index (HPI) is shown as an index with a base year of 2010. This HPI shows housing value appreciation since 2010. The HPI 2010 base year index is not available for all ZIP codes. Where tabulated, the HPI corresponds to a ZIP code area geography which may differ from the Census ZIP code area geography used elsewhere in this report. See the HPI by ZIP Code section for more information.
ZIP Business Patterns Notes. The ZIP Business Patterns (ZBP) provide data on the number of establishments, employment and earnings. The ZBP data corresponds to a ZIP code area geography which may differ from the Census ZIP code area geography used elsewhere in this report. ZBP data reflect place of employment whereas ACS data reflect place of residence. See the ZBP section for more information.
Detailed industry detail shown in section 3.1. use NAICS type of business codes. While the underlying database can be used to show all 6-digit detail, this profile is limited to 3-digit level, except for the Health Services sector (62) for which all types of business are shown.
Organization & Navigation. Use the Table of Contents at the top of the document to select a section by hyperlink.
Printing the Document; alternative file structures. The HTML page has built-in, invisible page breaks. Print the document in portrait mode.
Related Resources ... goto top
• ZIP Code Data Analytics
• ZIP Code Demographic-Economic Interactive Tables
.. General Demographics
.. Social Characteristics
.. Economic Characteristics
.. Housing Characteristics
• Hispanic Population by Specific Origin by ZIP Code
• ZIP Business Patterns - business establishments
• Health Care & Social Assistance Establishments by ZIP Code
• ZIP Code-County-Metro Equivalencing
• ZIP Code-City/Place Equivalencing
• Housing Price Index by ZIP Code
• ZIP Code Urban/Rural Interactive Table
• ZIP Code-Census Tract Equivalence Table
ProximityOne User Group
Join the ProximityOne User Group to keep up-to-date with new developments relating to metros and component geography decision-making information resources. Receive updates and access to tools and resources available only to members. Use this form to join the User Group.
Support Using these Resources
Learn more about accessing and using demographic-economic data and related analytical tools. Join us in a Data Analytics Lab session. There is no fee for these one-hour Web sessions. Each informal session is focused on a specific topic. The open structure also provides for Q&A and discussion of application issues of interest to participants.
Additional Information
ProximityOne develops geodemographic-economic data and analytical tools and helps organizations knit together and use diverse data in a decision-making and analytical framework. We develop custom demographic/economic estimates and projections, develop geographic and geocoded address files, and assist with impact and geospatial analyses. Wide-ranging organizations use our tools (software, data, methodologies) to analyze their own data integrated with other data. Follow ProximityOne on Twitter at www.twitter.com/proximityone. Contact us (888-364-7656) with questions about data covered in this section or to discuss custom estimates, projections or analyses for your areas of interest.
|
|