
|
|
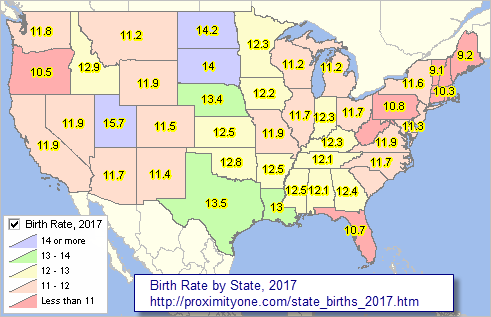
November 2018. The number of births is one of the population components of change for an area. Births add to the area population while deaths decrease the population and net migration can increase or decrease the population over a year or some period. It is important to know how an area's births are changing and why. Births and related birth measures can be key factors in determining the future for an area .. such as planning for infrastructure, schools and services or market development. Use the interactive table below to view, query, rank, compare birth characteristics for the U.S. and by state. A total of 3,855,500 births were registered in the U.S. in 2017, down 2% from 2016. Compared with rates in 2016, the general fertility rate declined to 60.3 births per 1,000 women aged 15–44. The birth rate for females aged 15–19 fell 7% in 2017. Birth rates declined for women in their 20s and 30s but increased for women in their early 40s. The total fertility rate declined to 1,765.5 births per 1,000 women in 2017. These are among final 2017 data on U.S. births developed and reported by the National Center for Health Statistics. This section provides 2017 births data by state and tools to examine patterns. These data are used by ProximityOne to develop demographic-economic estimates and projections to 2060, part of the Situation & Outlook program. We develop these estimates and projections to have access to more current data and develop insights into how, where, what change might occur -- and how change might impact us. Use the interactive table to view illustrative county projections to 2060. Birth Rate Patterns by State, 2017 - click graphic for larger view; expand browser window for best quality view. - labels show 2017 birth rate.  - view developed using CV XE GIS software and associated GIS project. - use these resources to develop similar views for any area. Modify subjects, zoom, colors, labels, add your data. - view Hawaii and Alaska using GIS project. U.S. & State 2017 Birth Characteristics .. interactive table .. goto top View, query, rank, compare birth characteristics for the U.S. and by state. Click ShowAll button between Find/Queries. Use mouseover on column header to view column description. -1 indicates data not available. See usage notes below table. See related interactive tables. Usage Notes • If table not showing any rows; click ShowAll button below table. • Use vertical and horizontal scroll bars to navigate up/down or left/right. • Adjust column widths using column divider between header cells. • All items are for 2017. • Census model based items .. "Population 7/1/17" is a Census model-based estimate at that point in time. .. "Births 7/1/17" is a model-based estimate for the period 7/1/16-6/30/18. • All other items are for calendar year 2017, developed by NCHS and based on reported birth data. • Click ShowAll button between specific area queries. • Cells with negative value could not be estimated/did not meet standards for publication. Terms Fertility rate. The general fertility rate (GFR) for the U.S. in 2017 was 60.3 births per 1,000 females aged 15–44, down 3% from 2016 (62.0), and a record low rate for the country. This is the third year that the rate has declined following an increase in 2014. Total fertility rate. The total fertility rate (TFR) for the U.S. in 2017 was 1,765.5 births per 1,000 women, down 3% from 2016 (1,820.5). This is the third year that the TFR has declined following an increase in 2014. From 2007 to 2013, the rate declined steadily. TFR estimates the number of births that a hypothetical group of 1,000 women would have over their lifetimes, based on age-specific birth rates in a given year. Because it is computed from age-specific birth rates, TFR is age adjusted and can be compared for populations across time, population groups, and geographic areas. Related Resources National Center for Health Statistics - Births: Final Data for 2017 - Births: Final Data for 2017; Supplemental Tables ProximityOne User Group Join the ProximityOne User Group to keep up-to-date with new developments relating to metros and component geography decision-making information resources. Receive updates and access to tools and resources available only to members. Use this form to join the User Group. Support Using these Resources Learn more about accessing and using demographic-economic data and related analytical tools. Join us in a Data Analytics Lab session. There is no fee for these one-hour Web sessions. Each informal session is focused on a specific topic. The open structure also provides for Q&A and discussion of application issues of interest to participants. Additional Information ProximityOne develops geodemographic-economic data and analytical tools and helps organizations knit together and use diverse data in a decision-making and analytical framework. We develop custom demographic/economic estimates and projections, develop geographic and geocoded address files, and assist with impact and geospatial analyses. Wide-ranging organizations use our tools (software, data, methodologies) to analyze their own data integrated with other data. Follow ProximityOne on Twitter at www.twitter.com/proximityone. Contact us (888-364-7656) with questions about data covered in this section or to discuss custom estimates, projections or analyses for your areas of interest. |
|
|