
|
|
|
Texas School Districts 2010-11 to 2014-15 Enrollment by Grade
.. examining how Texas school districts are changing ... this section provides an interactive table useful to examine patterns of Texas school district 2010-11 enrollment by grade, 2014-15 enrollment by grade and change over the 5 year period. Use the interactive table to view, rank, compare and query among school districts of interest. Optionally, examine only those districts in selected regions of interest (see region-by-region views below in this section). Use GIS resources reviewed in this section to create pattern maps to facilitate planning and decision-making. Knit these information resources together with related data for more comprehensive insights. See this Excel profile for Frisco ISD showing demographic-economic characteristics and trends for the district. How are districts that you use as comparables when evaluating your district similar/dissimilar to yours? How do areas of your district differ from one another, on a zip code or census tract level? Create your own profile for a district, sub-district area or other geography. Learn more about your district demographic-economic characteristics. Join use in an upcoming Web session where we review use of these resources. See details, set reminder -- June 23, 2015 ... June 30, 2015. Texas Patterns of Economic Prosperity by Census Tract The following map graphic shows a thematic pattern view of median household income by census tract based on ACS 2013 5-year estimates. Black boundaries show Education Service Center (ESC) areas with ESC code as label. Use the associated Geographic Information System (GIS) project to develop drill-down views for areas of interest. Knit together enrollment by grade by school district with other wide-ranging demographic-economic data. View communities/cities in context of school districts. Examine patterns or urban/rural geography by census blocks within one school district or a region. Add your own data. Contact us for more information. Mention 'Texas school district GIS' in the text section. 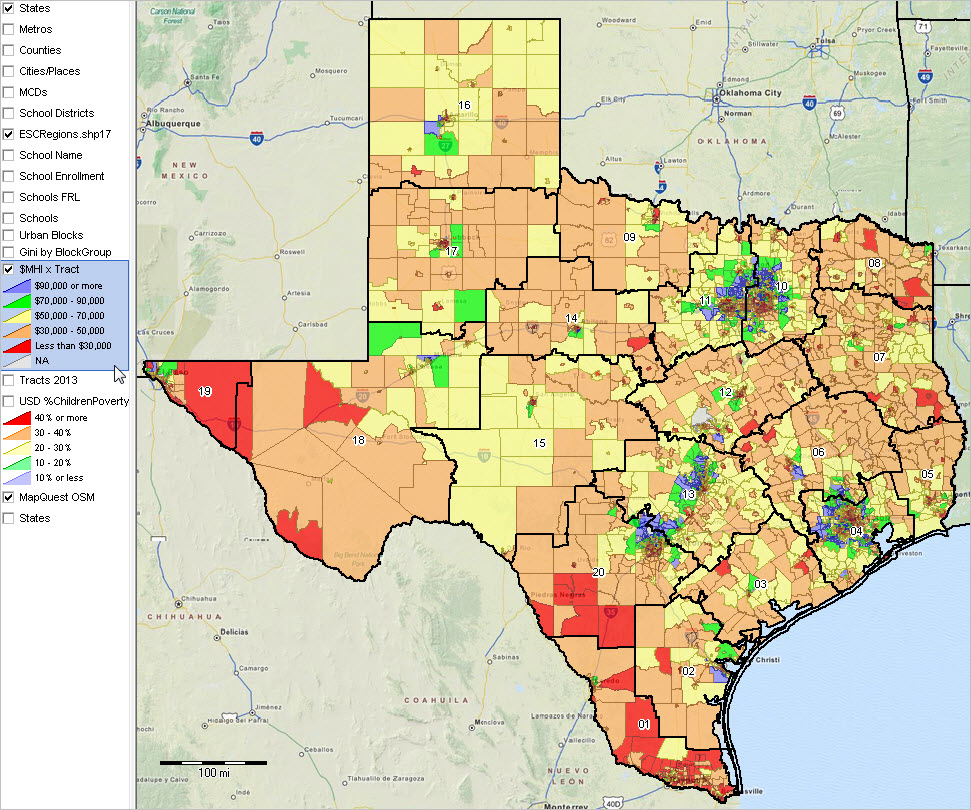 ... Click graphic for larger view with legend and more details. ... View developed using CV XE GIS. Map your own districts of interest. Texas Patterns of School District Enrollment %Change 2011-2015 Click graphic for larger view with legend and more details. See profile for Frisco ISD in larger view (Frisco at pointer in map). Use the GIS project to profile/label any district. 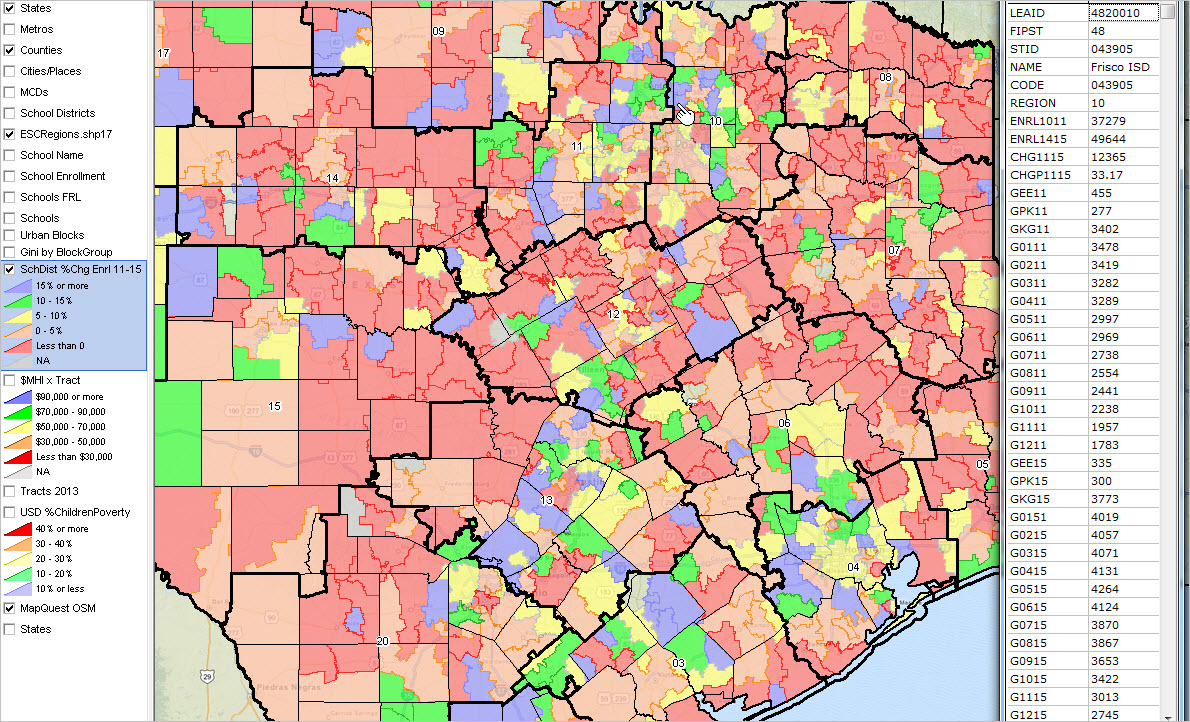 ... View developed using CV XE GIS. Map your own districts of interest. Houston Area School Districts District labeled with enrollment percent change 2010-11 to 2014-15 (upper label) and 2014-15 enrollment (lower label). Counties shown with bold gray boundary. 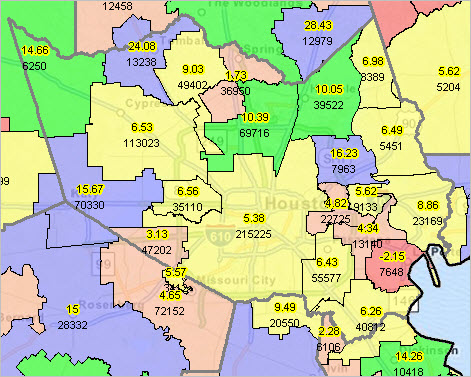 ... Click graphic for larger view. ... View developed using CV XE GIS. Map your own districts of interest. Largest and Fastest Growing Districts The following graphics show characteristics of the largest and fastest growing LEAs. These graphics have been developed using the interactive table shown below. Use the table to develop similar views by ESC region. 10 Largest Texas School Districts; 2010-2011 Enrollment 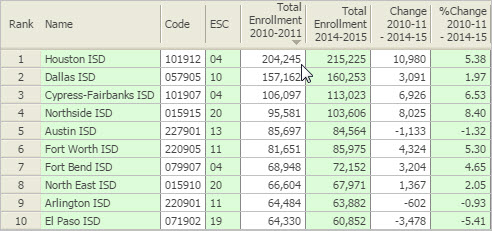 ... Click graphic for larger view. 10 Largest Texas School Districts; 2014-2015 Enrollment 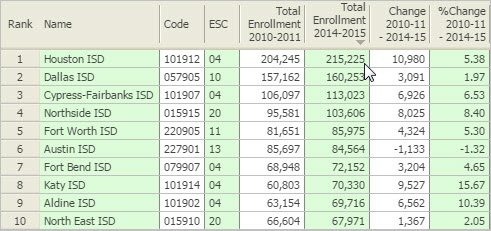 ... Click graphic for larger view. 10 Largest Texas School Districts; Enrollment Change 2010-11 - 2014-15 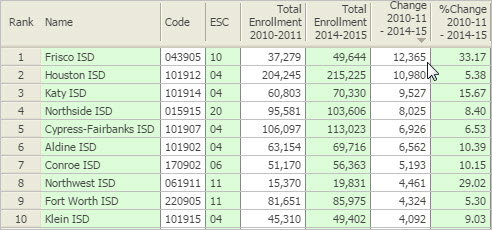 ... Click graphic for larger view. 10 Largest Texas School Districts; Enrollment Percent Change 2010-11 - 2014-15 This graphic shows districts -- having 2014-15 enrollment of 10,000 or more -- ranked in descending order on enrollment percent change 2010-11 to 2014-15. View different sets of districts by setting the enrollment threhhold (below interactive table) to a different value. The value 0 includes all districts (also the set shown when ShowAll button is clicked. 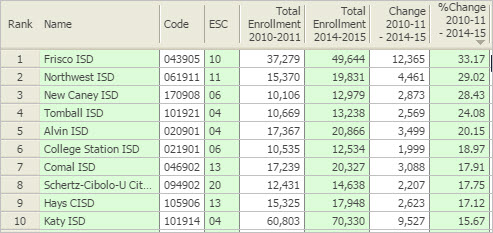 ... Click graphic for larger view. Texas School Districts; Enrollment by Grade; 2010-11 & 2014-15 - Interactive Table See usage notes below table. See related tables -- http://proximityone.com/rankingtables.htm. Click ShowAll button between Find/Queries. Using the Ranking Table • Click on a column header to sort on that column; click column header again to sort in other direction. • Click ShowAll button to show all tabulation areas and restore full set of data view. • Click Region to select districts only in one region. • Name Query -- key in school district name (case sensitive) in text box to right of "Find-in-Name" button. - Next, click "Find-in-Name" button to locate all matches. - case sensitive; click ShowAll button between queries. • Threshold Query -- use this to filter the table based on 2014-15 Enrollment. - click ShowAll; enter threshold value, e.g., 30000; click "2014-15 Enrollment Minimum" button - table now shows all districts having 30,000 or more enrollment in 2014-15 school year. - optionally filter this group by region; select a region; e.g., region 1; table now shows all districts having 30,000 or more in region 1. - if filtering on both threshold and region, do threshold first, then region. - no further region or threshold queries are possible until page refresh or clicking ShowAll button. Column Headers Use mouse-over on interactive table header cells to view name/description of item/column. Regional Pattern Views -- showing patterns of percent enrollment change 2011-2015 Bold black boundaries show Texas Education Service Center (ESC) regions. The ESC region number is shown as white label. See state by region map at top of this section. Region 1 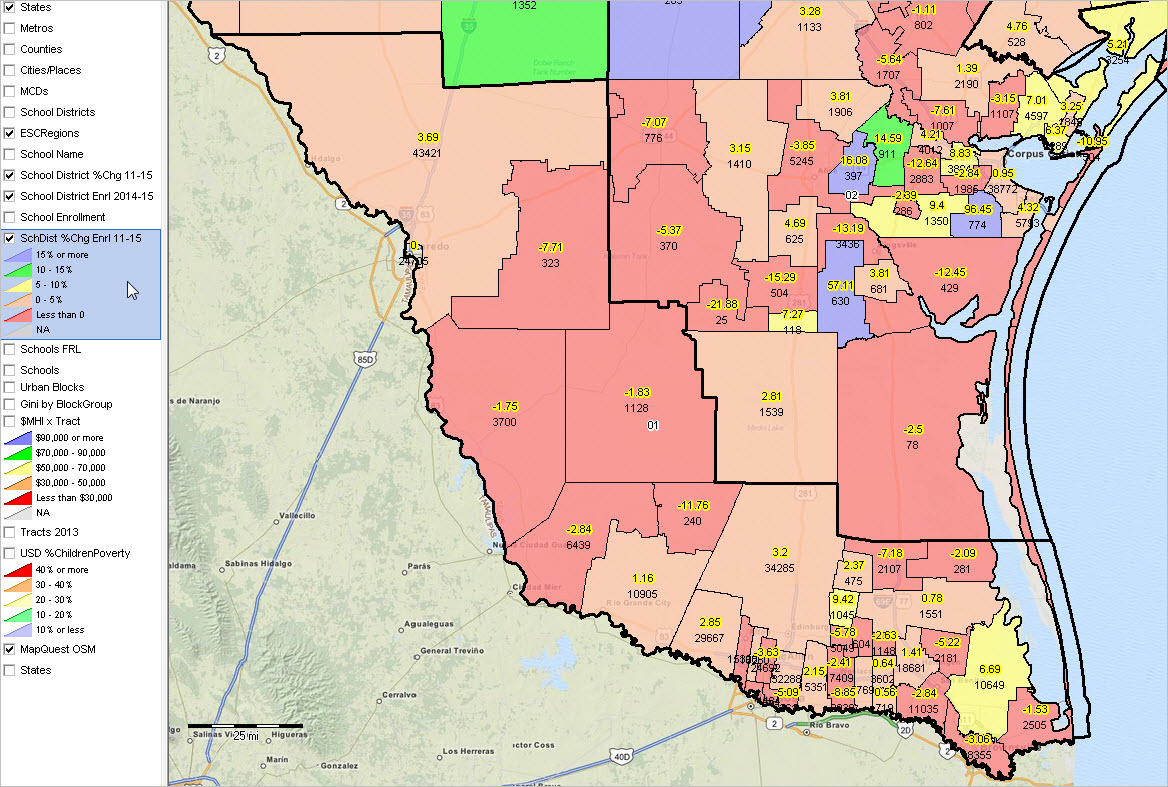 ... Click graphic for larger view showing more detail. Region 2 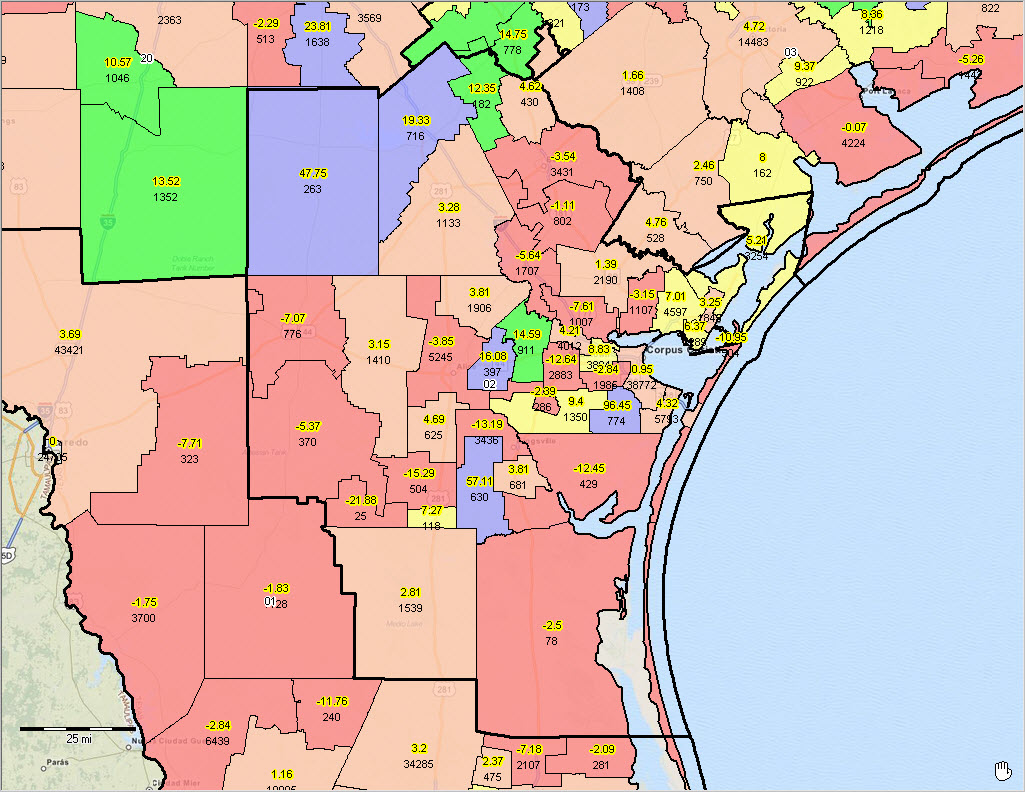 ... Click graphic for larger view showing more detail. Region 3 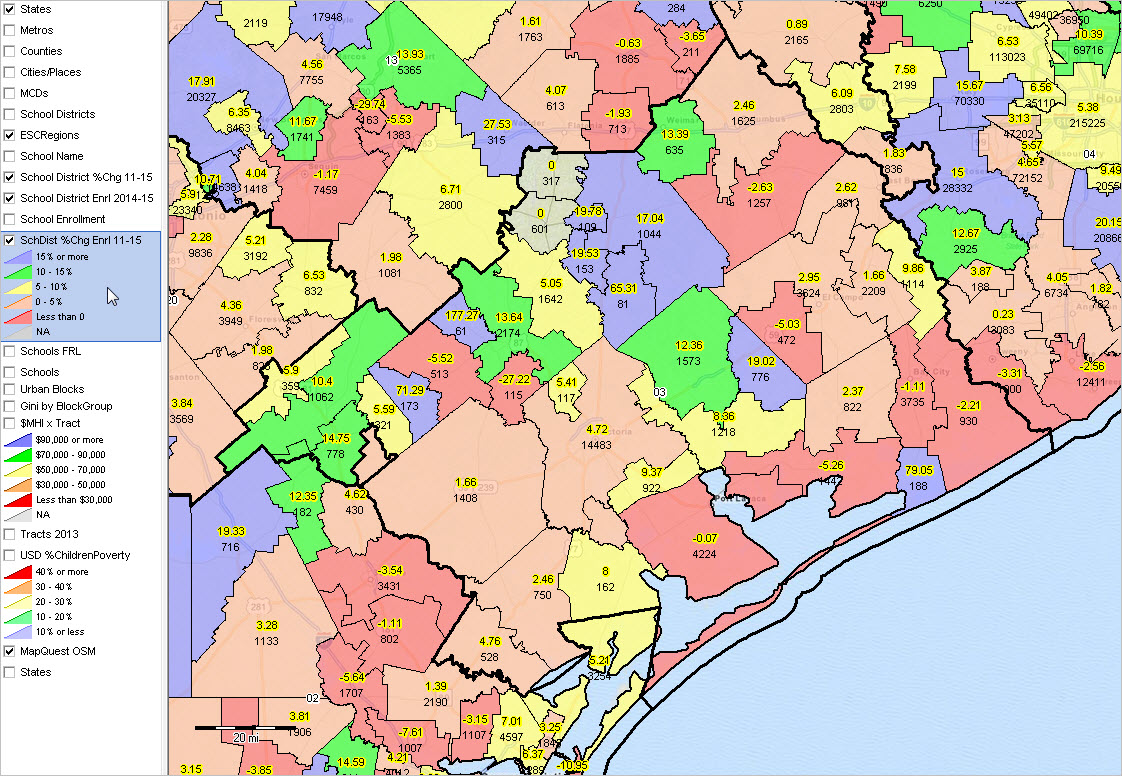 ... Click graphic for larger view showing more detail. Region 4 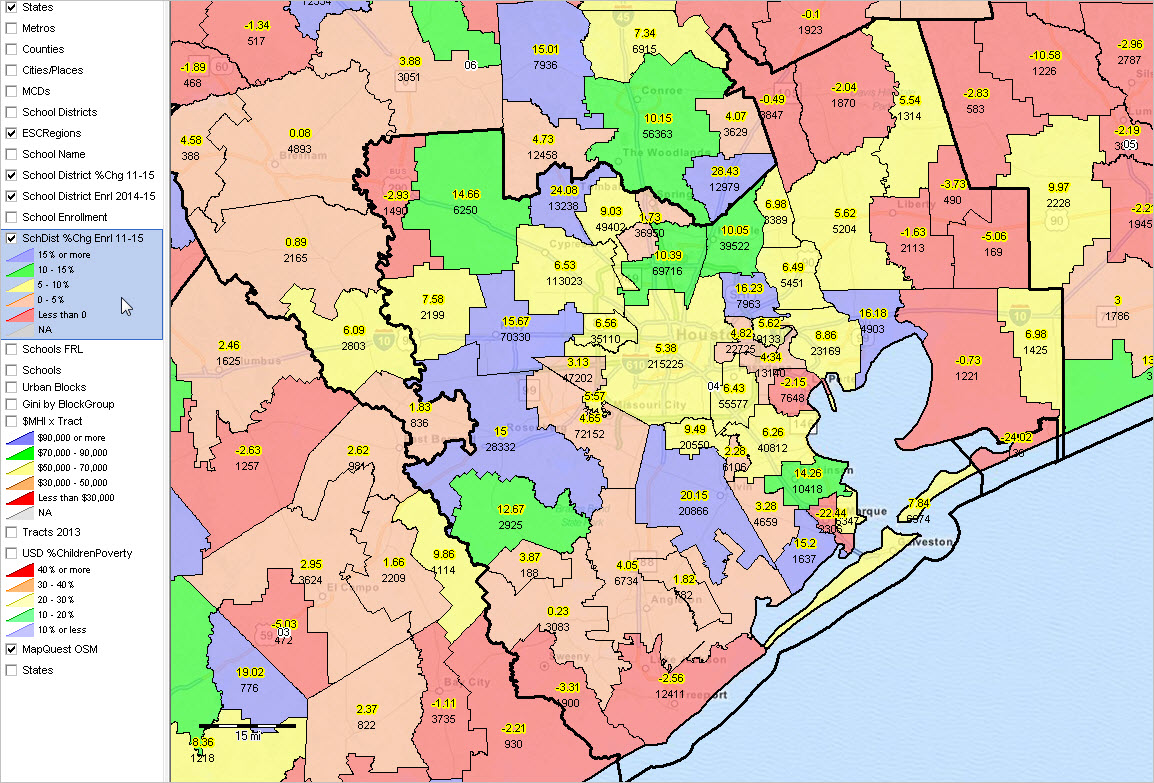 ... Click graphic for larger view showing more detail. Region 5 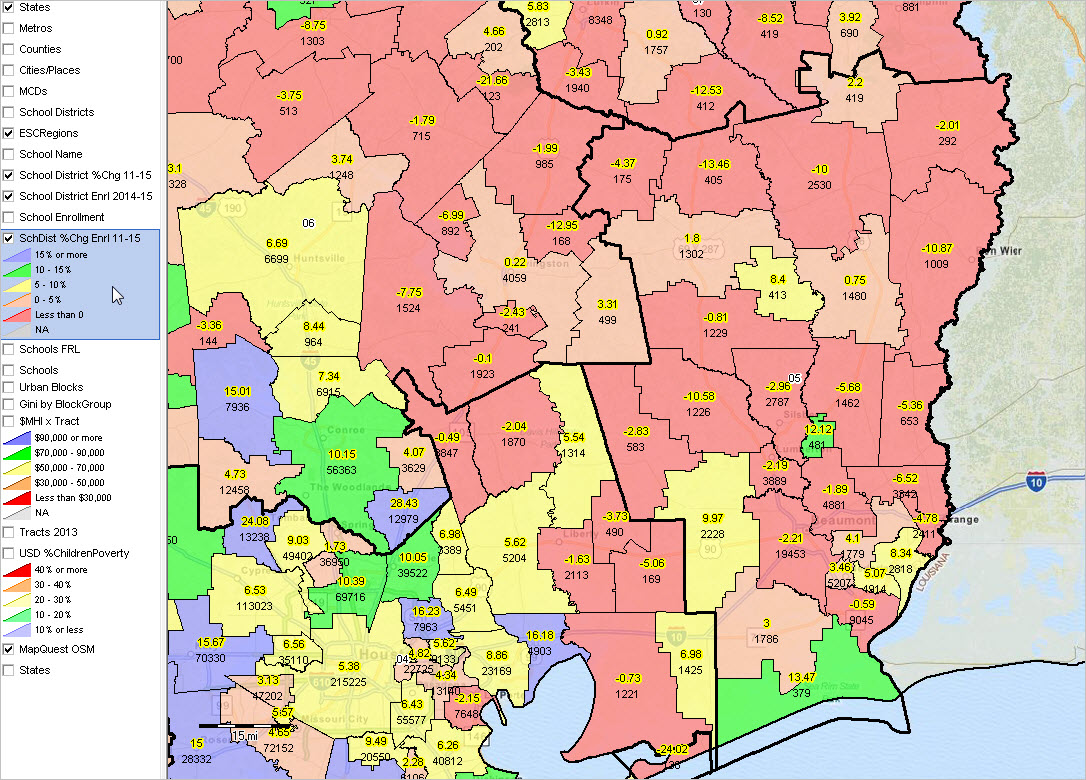 ... Click graphic for larger view showing more detail. Region 6 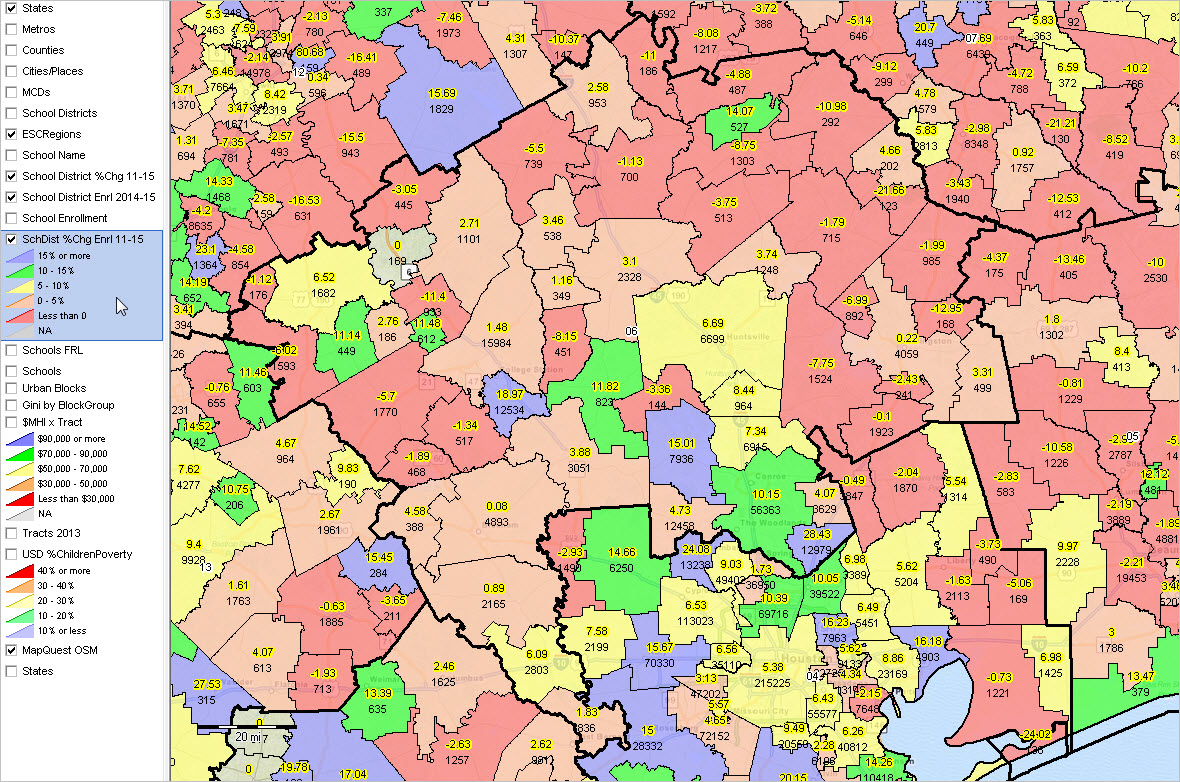 ... Click graphic for larger view showing more detail. Region 7 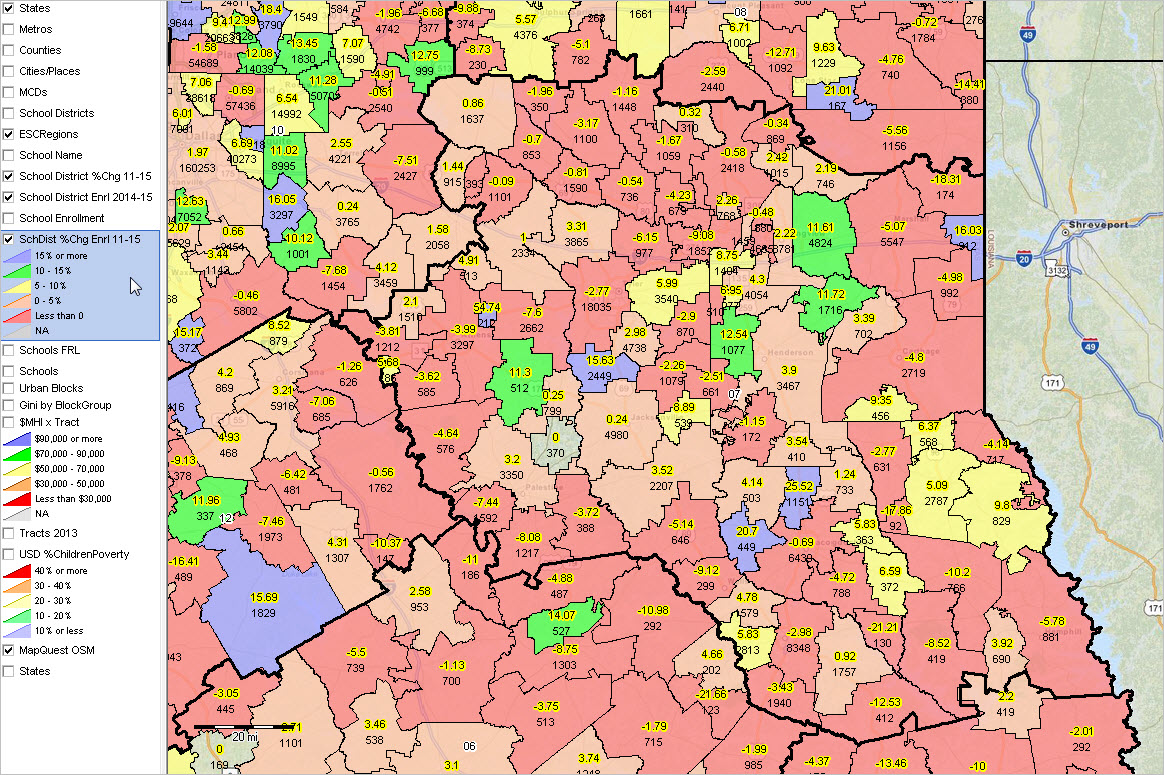 ... Click graphic for larger view showing more detail. Region 8  ... Click graphic for larger view showing more detail. Region 9  ... Click graphic for larger view showing more detail. Region 10 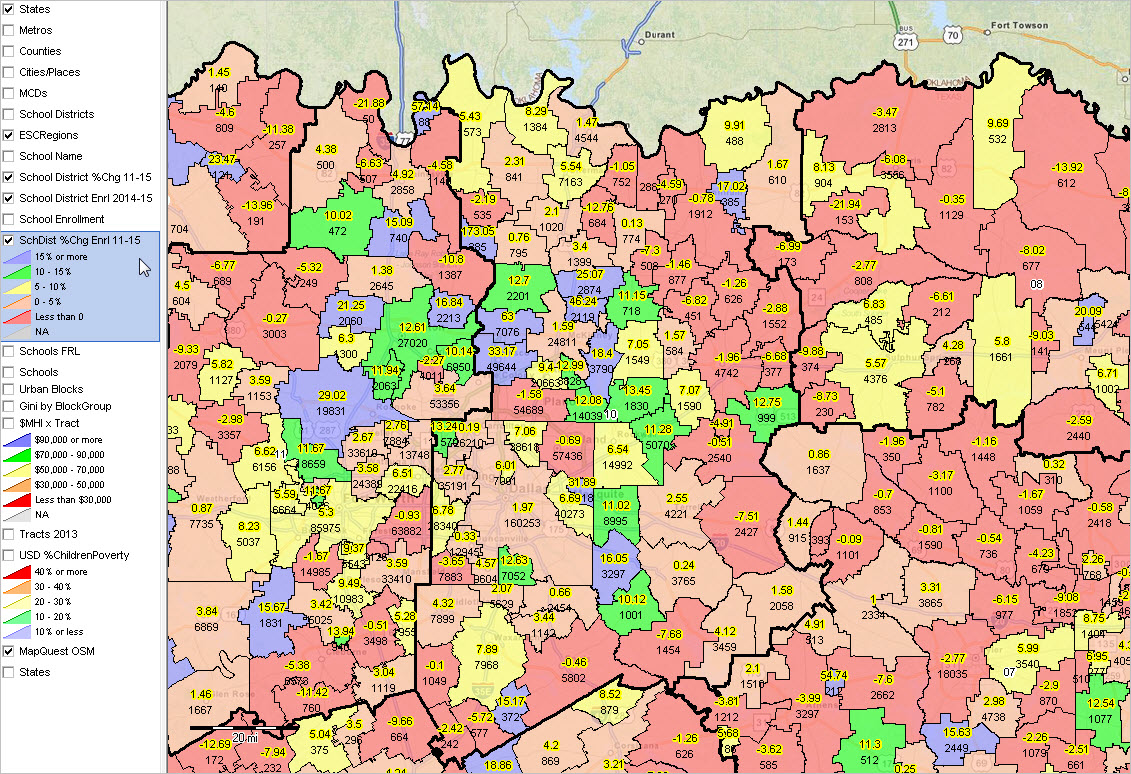 ... Click graphic for larger view showing more detail. Region 11 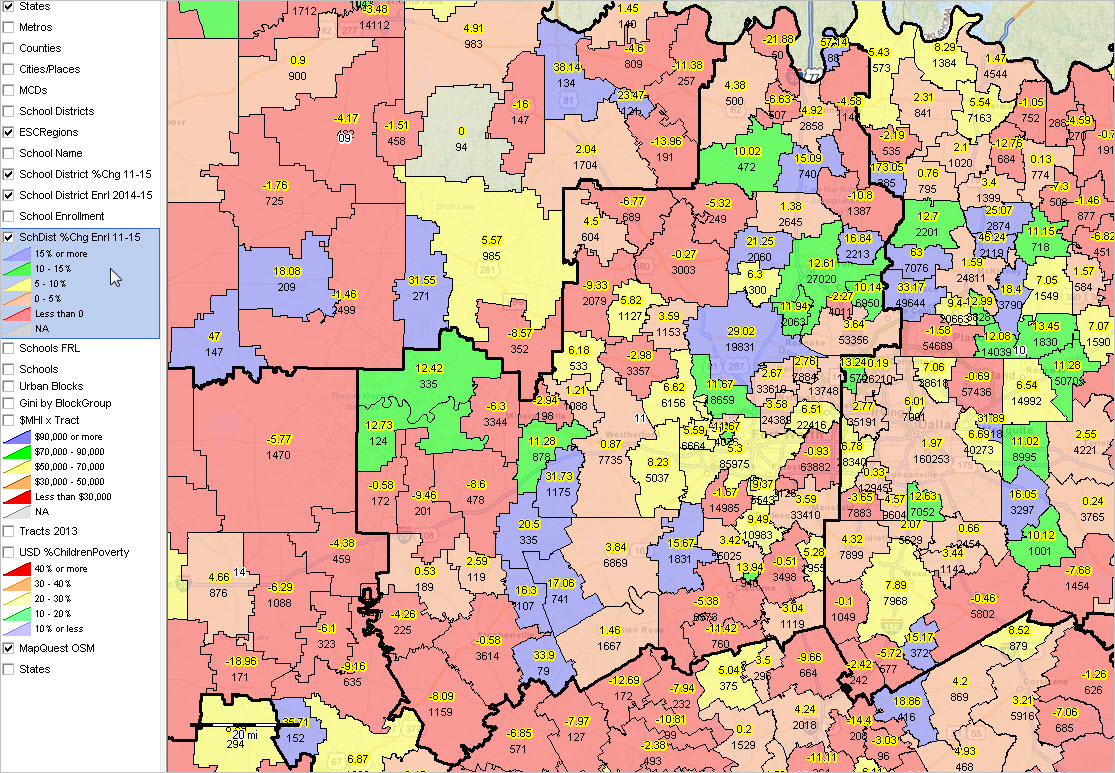 ... Click graphic for larger view showing more detail. Region 12 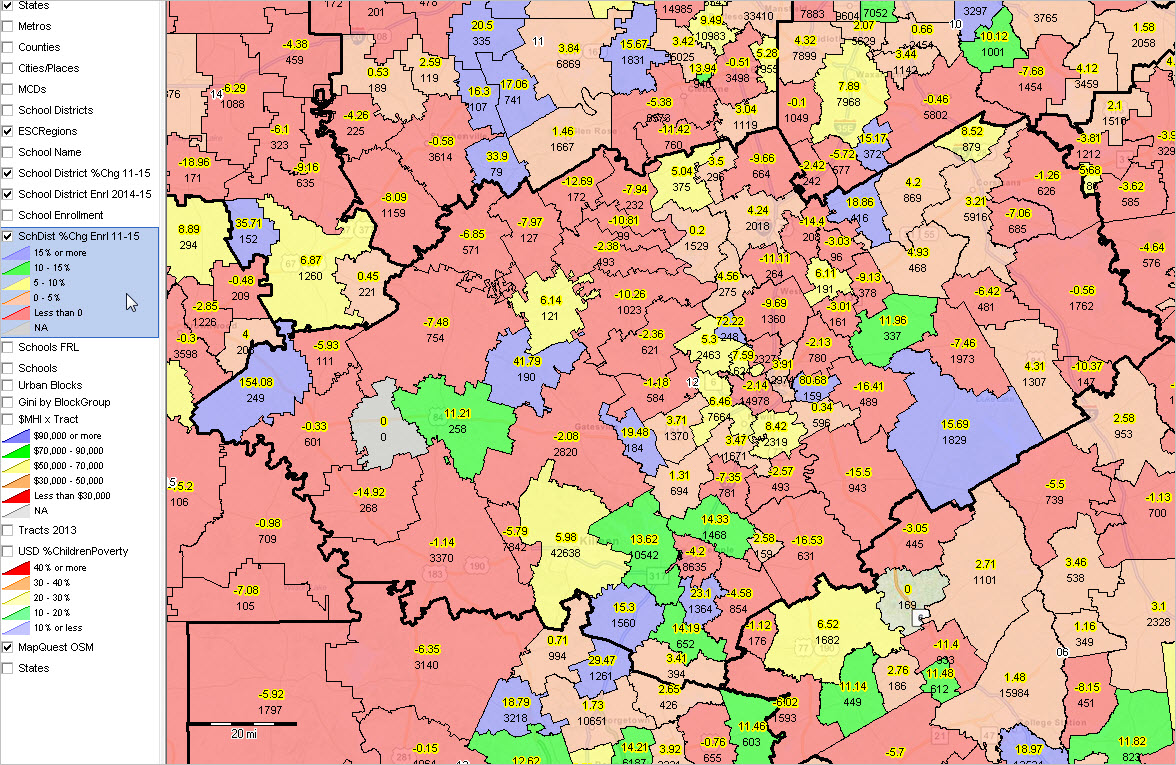 ... Click graphic for larger view showing more detail. Region 13 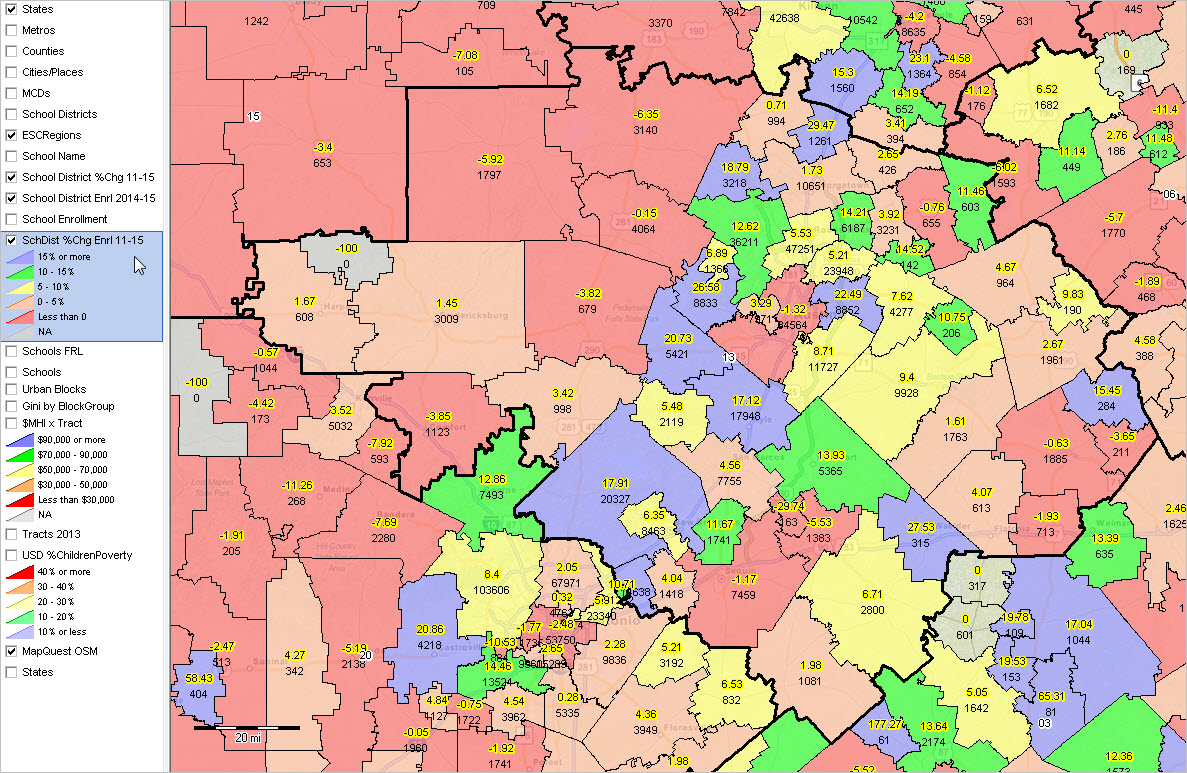 ... Click graphic for larger view showing more detail. Region 14  ... Click graphic for larger view showing more detail. Region 15 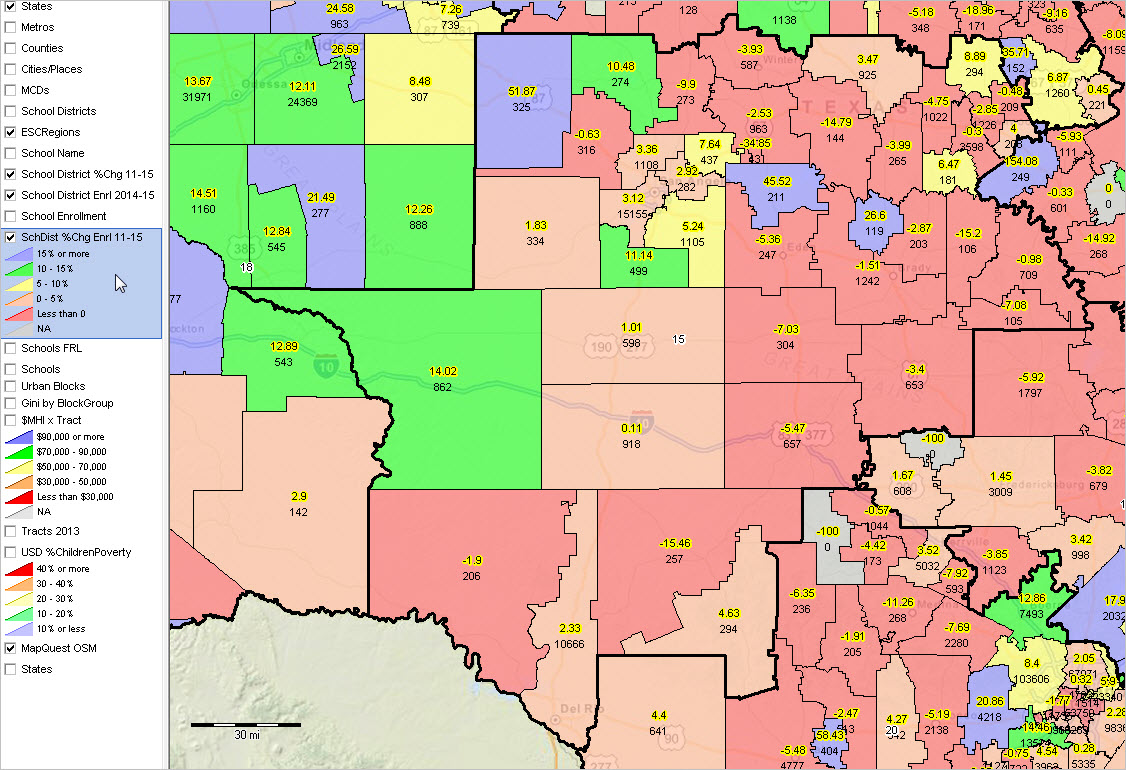 ... Click graphic for larger view showing more detail. Region 16 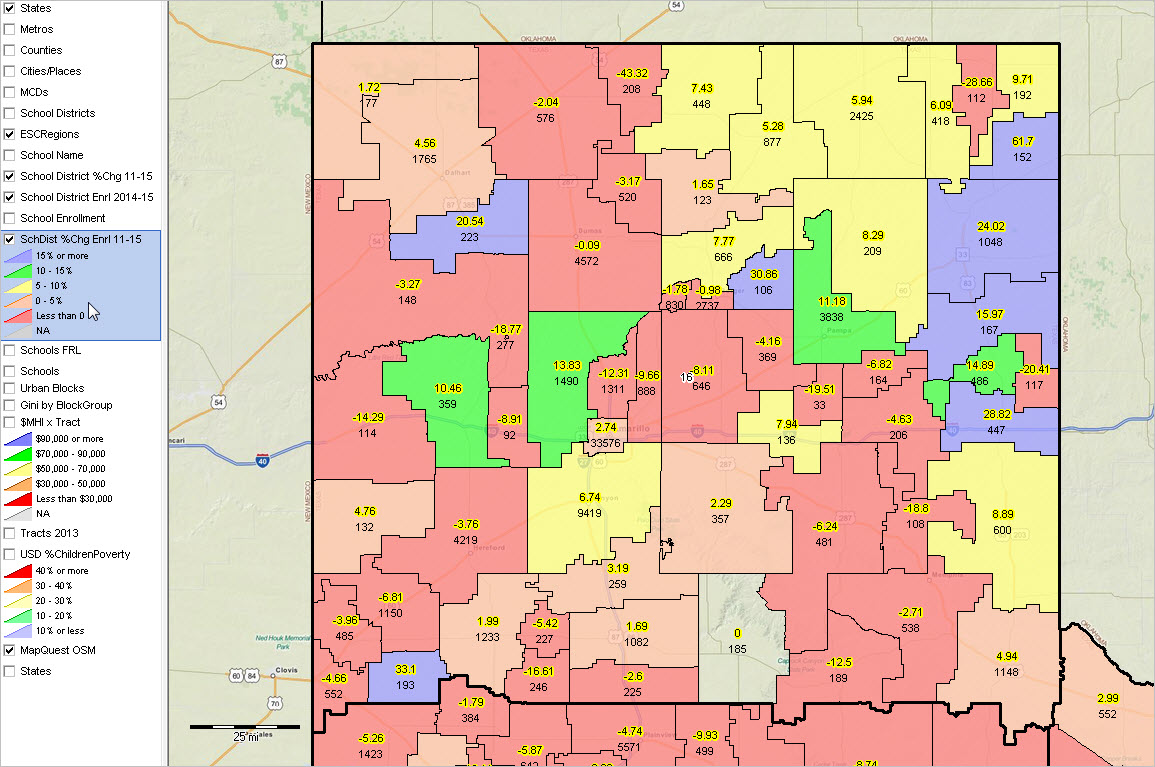 ... Click graphic for larger view showing more detail. Region 17 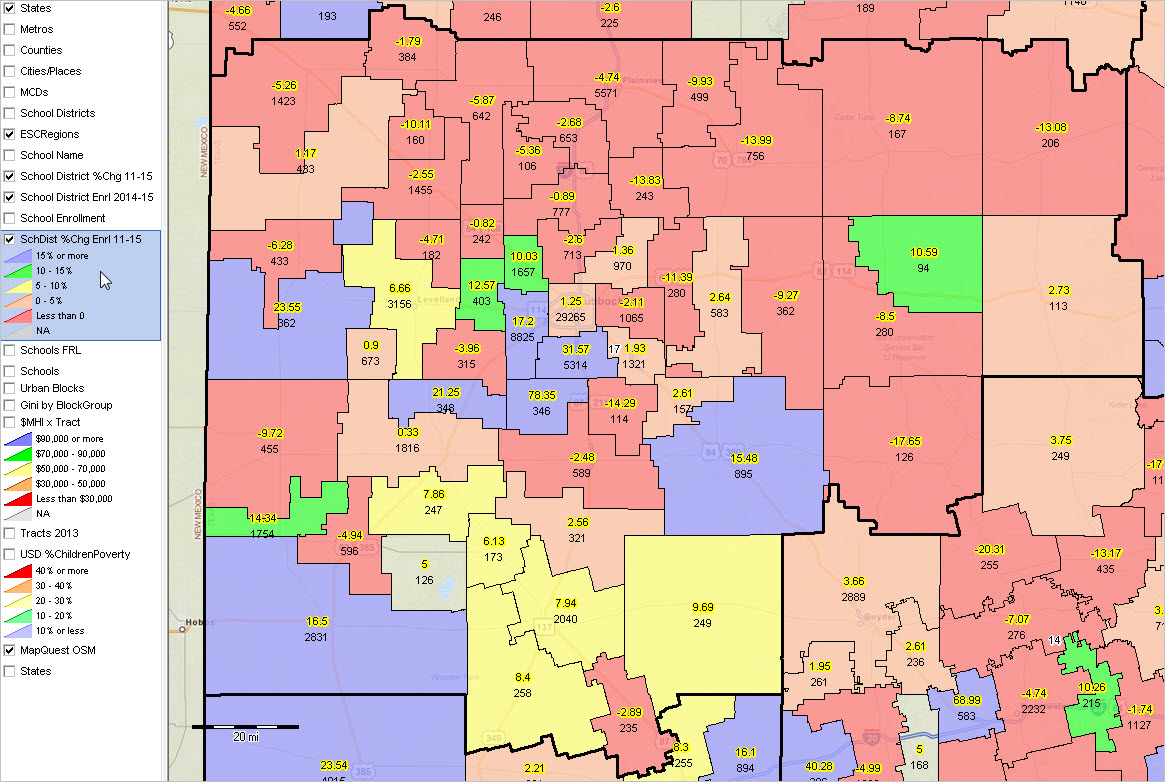 ... Click graphic for larger view showing more detail. Region 18 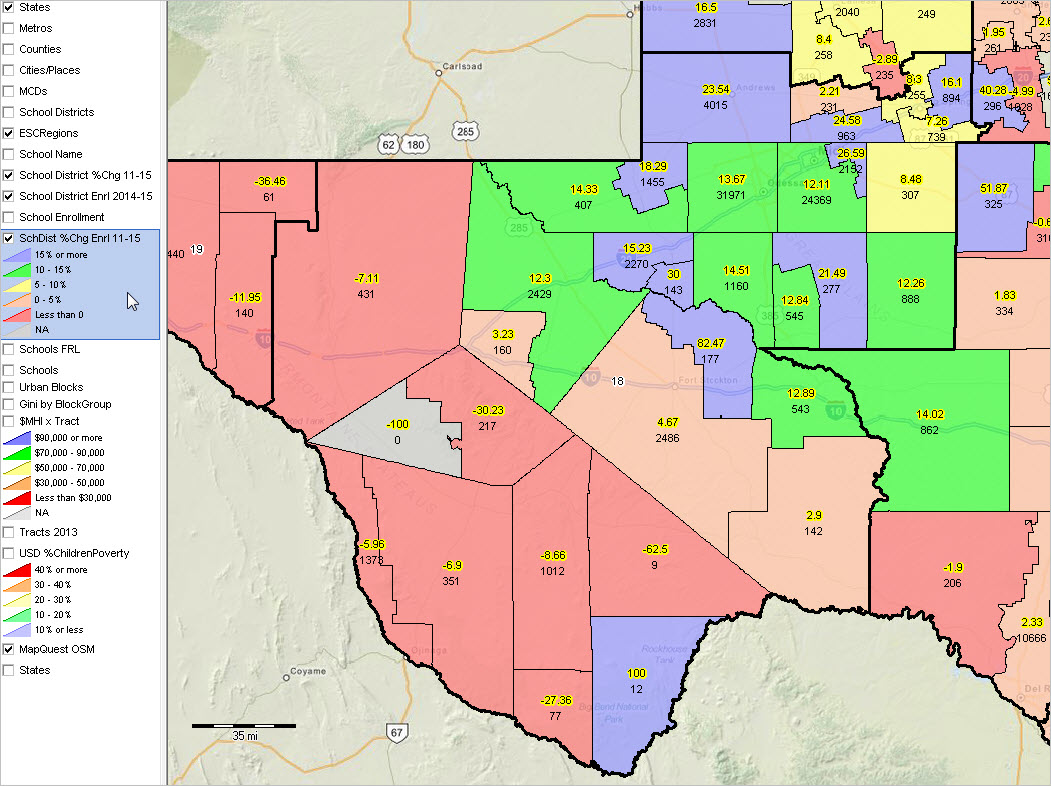 ... Click graphic for larger view showing more detail. Region 19 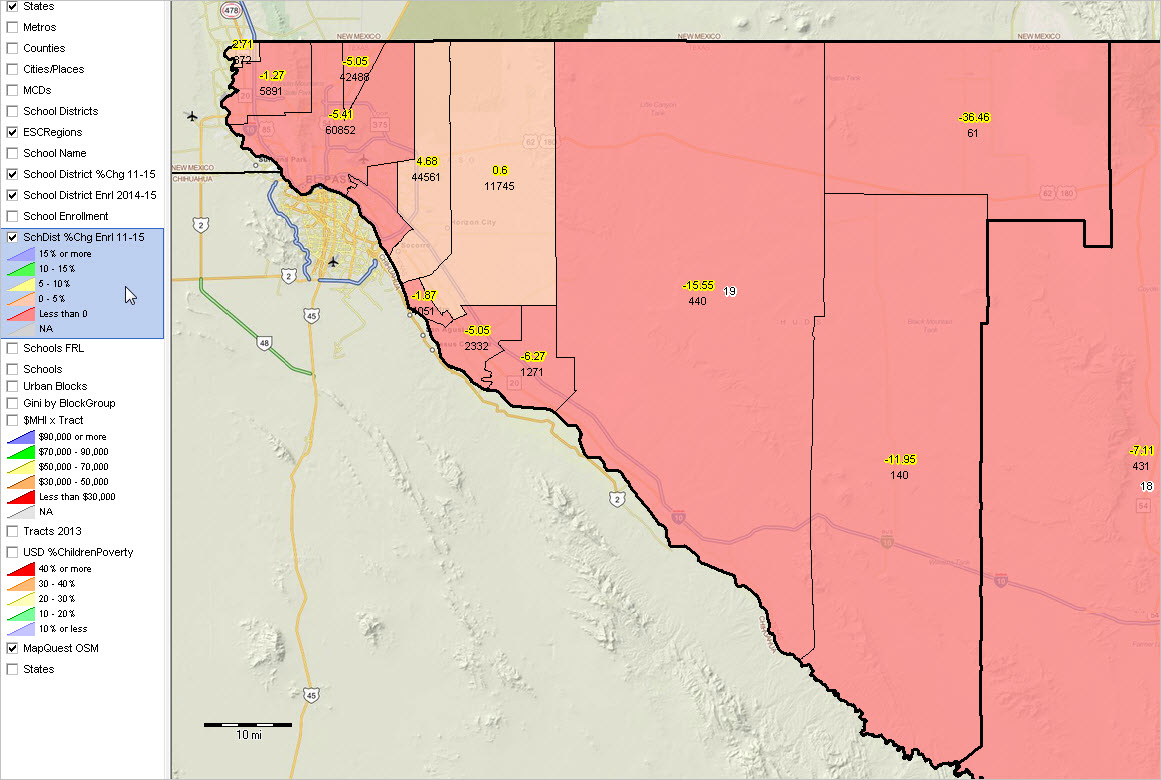 ... Click graphic for larger view showing more detail. Region 20 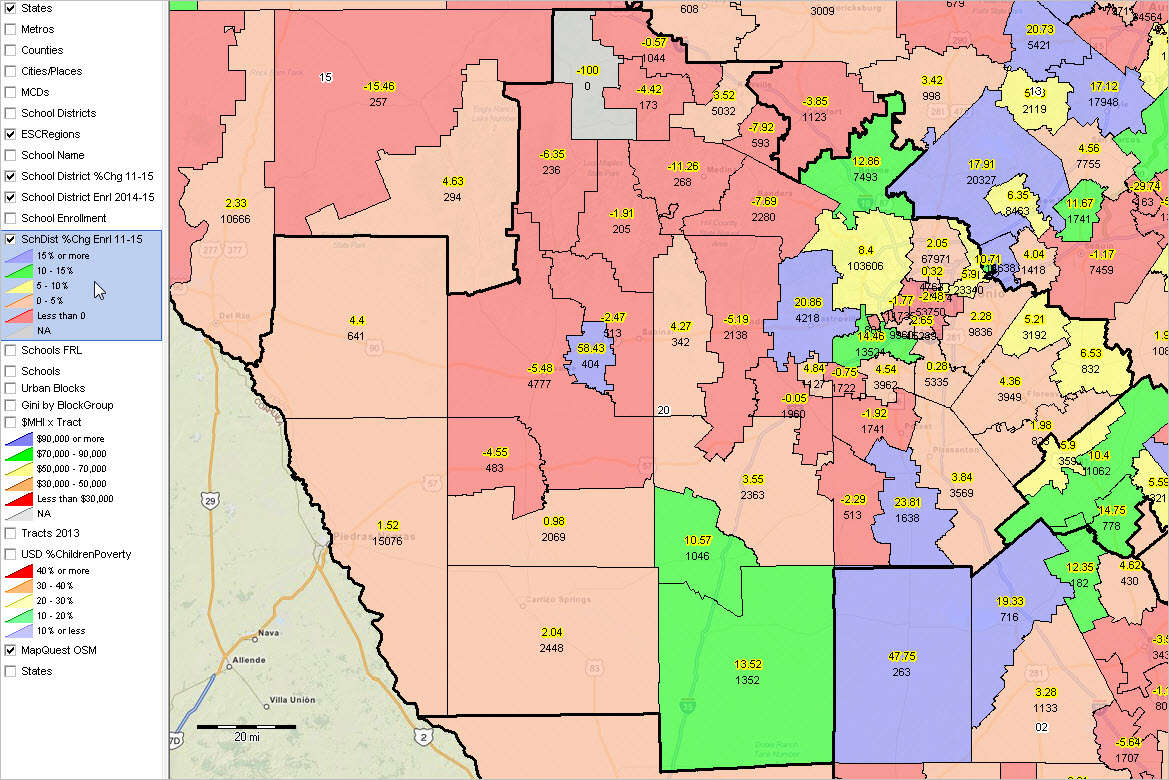 ... Click graphic for larger view showing more detail. Support Using these Resources Learn more about demographic economic data and related analytical tools. Join us in a Data Analytics Web session. There is no fee for these Web sessions. Each informal session is focused on a specific topic. The open structure also provides for Q&A and discussion of application issues of interest to participants. ProximityOne User Group Join the ProximityOne User Group to keep up-to-date with new developments relating to geographic-demographic-economic decision-making information resources. Receive updates and access to tools and resources available only to members. Use this form to join the User Group. Additional Information ProximityOne develops geographic-demographic-economic data and analytical tools and helps organizations knit together and use diverse data in a decision-making and analytical framework. We develop custom demographic/economic estimates and projections, develop geographic and geocoded address files, and assist with impact and geospatial analyses. Wide-ranging organizations use our tools (software, data, methodologies) to analyze their own data integrated with other data. Follow ProximityOne on Twitter at www.twitter.com/proximityone. Contact ProximityOne (888-364-7656) with questions about data covered in this section or to discuss custom estimates, projections or analyses for your areas of interest. |
|
|