
|
|
|
County-level age cohort demographic trends are important in a wide range of planning and analytical applications. These data tie into an extensive array of related, frequently updated county demographic-economic data. The primary statistical and political sub-divisions of states, counties are also the building blocks for metropolitan statistical areas. This section reviews availability and use of U.S. by county age cohort annual data for the period 2010 through 2014. See more about these data. A U.S. national scope county dataset, containing annual 5-year age cohort data (ages 0-4 through 80-84 and 85 years and over) developed by ProximityOne is used. These data are integrated into a shapefile which is a part of a GIS project. Members of the ProximityOne User Group may analyze characteristics and patterns of individual counties or groups of counties with the ready-to-use GIS project and CV XE GIS software. See details below. Examining Population Ages 65 Years & Over Patterns The nation's 65 and older population grew from 44.7 million in 2013 to 46.2 million in 2014. This group, which now contains the oldest four years of the baby boom generation (born between 1946 and 1964), is 21.7 percent minority, less diverse than younger age groups. Between 2010 and 2014, two counties added more than 100,000 people 65 and older to their total populations -- Los Angeles, CA (167,000) and Maricopa, AZ (103,000). In Fort Bend County, TX (Houston metro), the population 65 and older increased by 21,066 (48.3 percent) between 2010 and 2014 (see details below). How will these characteristics change by 2020? 2060? relate to others? .. insights using our projections and modeling tools. Population 65 Years & Over; Percent Change 2010-2014 by County 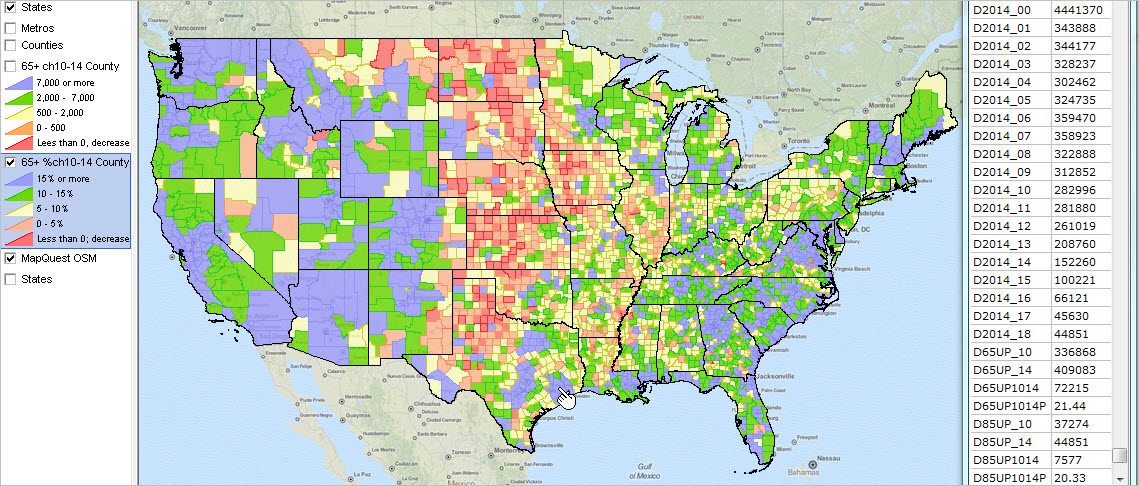 - click graphic for larger view; view developed using CV XE GIS - larger view shows 2014 population by age and population change for Harris County, TX Population 65 Years & Over; Change 2010-2014 by County 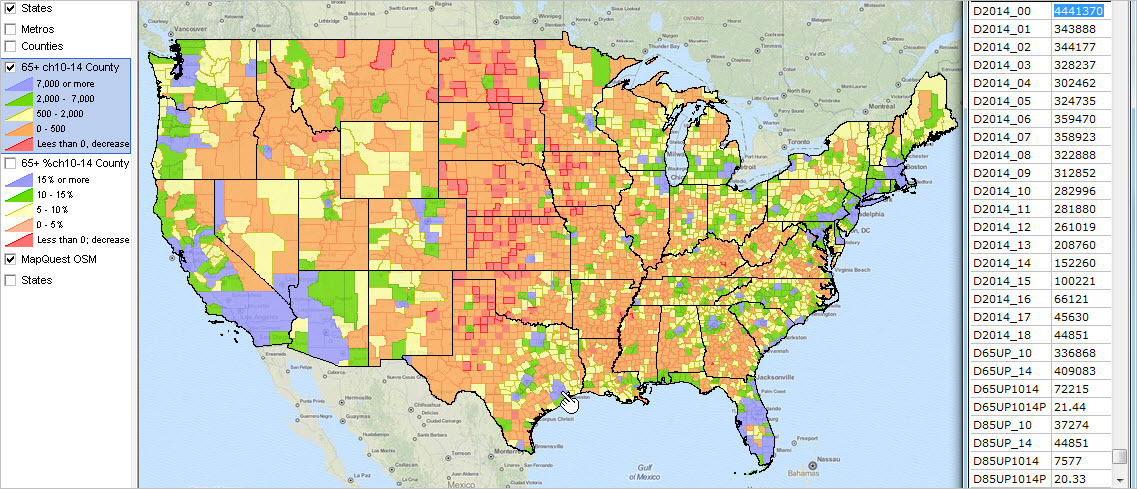 - click graphic for larger view; view developed using CV XE GIS - larger view shows 2014 population by age and population change for Harris County, TX Tabular View of Data The following table illustrates use of the database feature to view selected fields for Texas counties. These are 10 Texas counties having the largest 2014 population age 65 and over. The fields manager has been used to show only selected fields. Column headers show field names described in the subject matter scroll section below. The top row shows that in Fort Bend county, • the 2010 population ages 65 and over was 43,500 • the 2014 population ages 65 and over was 64,666 • the 2010-2014 population ages 65 and over change was 21,066 • the 2010-2014 population ages 65 and over percent change was 48.32 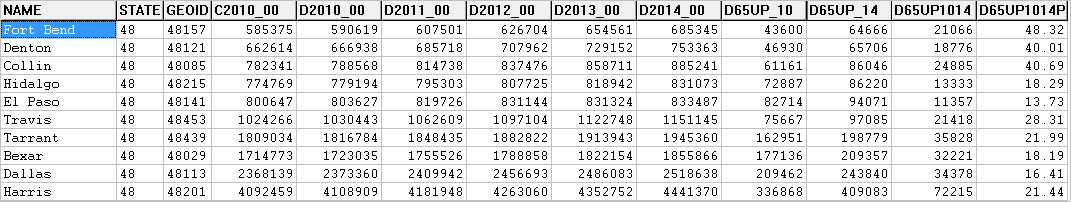 - click graphic for larger view; view developed using CV XE GIS database features While the illustrative applications used in this section are focused on the population ages 65 and over, any one or combination of 5-year age cohort data can be analyzed using the GIS project and datasets. The U.S. by county shapefile contains the fields described in the scroll section below. Creating Map Pattern Views & Visual Analysis (requires Windows computer with Internet connection) 1. Install the ProximityOne CV XE GIS ... run the CV XE GIS installer ... take all defaults during installation 2. Download the U.S. by County Population by Age 2010-2014 GIS project fileset ... requires ProximityOne User Group ID (join now) ... unzip U.S. County Population by Age 2010-2014 GIS project files to local folder c:\ctypop 3. Open the GIS project ... after completing the above steps, click File>Open>Dialog ... open the file named c:\ctypop\ctypop2014_age.gis 4. Done. The start-up view is similar to the graphic shown at the top of this section. County Subject Matter Items & Field Names -- scroll section
ProximityOne User Group Join the ProximityOne User Group to keep up-to-date with new developments relating to metros and component geography decision-making information resources. Receive updates and access to tools and resources available only to members. Use this form to join the User Group. Support Using these Resources Learn more about accessing and using demographic-economic data and related analytical tools. Join us in a Data Analytics Lab session. There is no fee for these one-hour Web sessions. Each informal session is focused on a specific topic. The open structure also provides for Q&A and discussion of application issues of interest to participants. Additional Information ProximityOne develops geographic-demographic-economic data and analytical tools and helps organizations knit together and use diverse data in a decision-making and analytical framework. We develop custom demographic/economic estimates and projections, develop geographic and geocoded address files, and assist with impact and geospatial analyses. Wide-ranging organizations use our tools (software, data, methodologies) to analyze their own data integrated with other data. Follow ProximityOne on Twitter at www.twitter.com/proximityone. Contact ProximityOne (888-364-7656) with questions about data covered in this section or to discuss custom estimates, projections or analyses for your areas of interest. |
|
|