|
|
Decision-Making Information

|
ProximityOne
information resources & solutions
(888) DMI-SOLN
(888) 364-7656
|
Visual analysis with ProximityOne tools
click graphic for info; hover to pause
|
Columbia, SC Metro Demographic Trends 2010-2060
... examining demographic estimates & projections
Assessing metropolitan area competitive position, needs and opportunities requires knowing
about demographic-economic composition and trends.
This section illustrates the structure and use of ProximityOne demographic projections to 2060
for the Columbia, SC metro and tools to view and analyze these data.
Operations shown here can be applied to any metro or county.
These data are part of the ProximityOne
Outlook2060 and
Situation & Outlook resources.
Columbia, SC Metropolitan Area ... view developed using CV XE GIS.
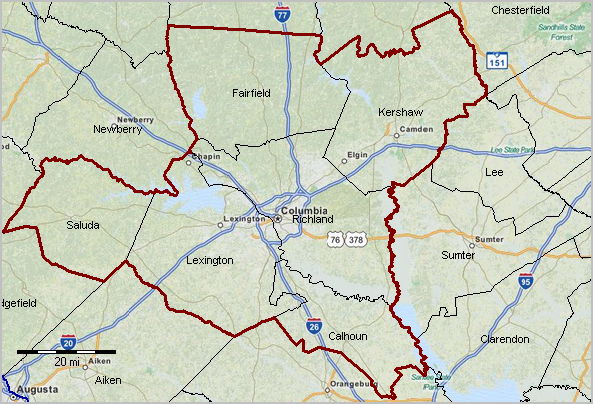
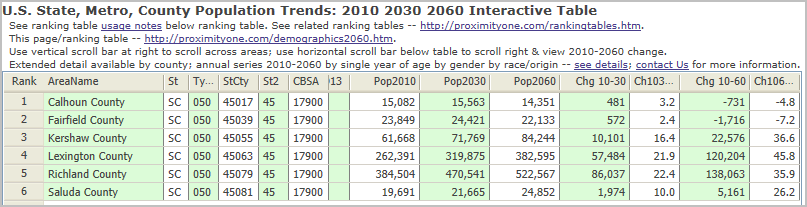
The Columbia, SC Metro by County Population Trends, 2010-2060 are summarized in the graphic below.
This graphic is a snapshot of the all U.S. by state/county interactive table available
at http://proximityone.com/demographics2060.htm.
This view shows a row for each Columbia, SC metro county with Census 2010 population and projections
to 2030 and 2060. The projections are developed using the ProximityOne
Modeler.
Column Headers - scroll section
• Type - Type of geography; summary level (see below)
• StCty - State + County FIPS Code
• CBSA - Core-Based Statistical Area Code (2009/Census 2010/ACS 2012 vintage)
see list of names/codes
• MD - Metropolitan Division Code (2009/Census 2010/ACS 2012 vintage)
• CBSA13 - Core-Based Statistical Area Code (2013 vintage)
see list of names/codes
• MD13 - Metropolitan Division Code (2013 vintage)
• Pop2010 -- Census 2010 (Census Bureau; ProximityOne; summarized from age cell data)
• Pop2030 -- population mid-2030 (ProximityOne)
• Pop2060 -- population mid-2060 (ProximityOne)
• Ch2010-30 -- population change 2010 to 2030
• %Ch2010-30 -- percent population change 2010 to 2030
• Ch2010-60 -- population change 2010 to 2060
• %Ch2010-60 -- percent population change 2010 to 2060
Extended Demographic Detail
The Modeler develops county level projections
and stores these data in county level datasets. See XLS example for Sedgwick County (Wichita) KS (opens xls file).
See more about the file content and structure.
The CV XE Outlook module can be used with the county or multi-county extended demographic datasets.
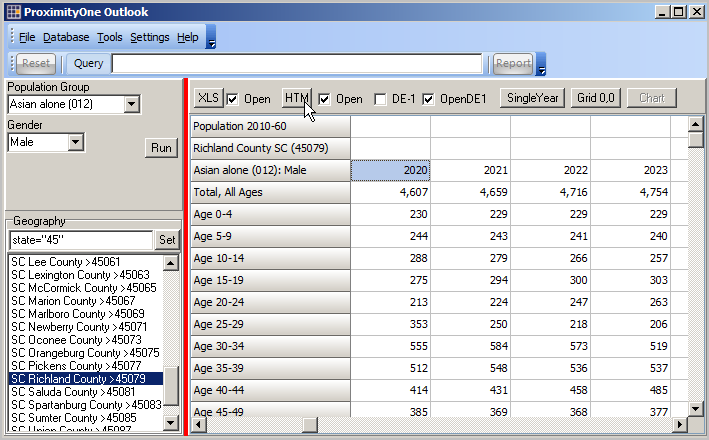
The graphic shown below illustrates the CV XE Outlook operation used to display Richland County, SC projections for the
Asian alone male population. By selecting from race/origin and gender dropdown options,
the user can generate many different combinations and examine trends over time.
The year 2020 is highlighted in the graphic.
This view shows there are 230 projected Asian alone males, ages 0-4 years, in Richland County in 2020.
Population by selected age cohort and single year of age are displayed by row in the grid.
Data are displayed by year, 2010 to 2060, across columns.
The grid data may be output to HTML (see pointer) or XLS.
The scroll section below the graphic shows the HTML output from the grid display shown in the graphic.
Richland County Asian alone Male Population by Single Year of Age & Age Cohort: 2010-2060
... scroll section ... use vertical scroll bar at right to scroll across ages;
... use horizontal scroll bar below section to scroll across years.
| Outlook2060 Profile by Single Year & Selected Age Cohort 2010-2060 |
| Richland County SC (45079) | | | | | | | | | | | |
| Total population: All | 2010 | 2011 | 2012 | 2013 | 2014 | 2015 | 2016 | 2017 | 2018 | 2019 | 2020 |
| Total, All Ages | 384,504 | 389,386 | 394,356 | 399,271 | 403,973 | 408,648 | 413,282 | 417,836 | 422,379 | 426,810 | 431,193 |
| Age 0-4 | 24,463 | 24,342 | 24,192 | 24,155 | 24,042 | 24,166 | 24,296 | 24,424 | 24,555 | 24,687 | 24,826 |
| Age 5-9 | 24,038 | 24,321 | 24,715 | 24,993 | 25,179 | 25,170 | 25,051 | 24,893 | 24,862 | 24,740 | 24,871 |
| Age 10-14 | 23,746 | 24,050 | 24,304 | 24,410 | 24,699 | 24,778 | 25,072 | 25,438 | 25,737 | 25,930 | 25,906 |
| Age 15-19 | 33,358 | 27,579 | 24,905 | 24,448 | 24,237 | 24,456 | 24,772 | 24,996 | 25,117 | 25,423 | 25,487 |
| Age 20-24 | 40,822 | 44,474 | 44,899 | 42,529 | 38,884 | 33,964 | 28,220 | 25,539 | 25,089 | 24,890 | 25,108 |
| Age 25-29 | 31,273 | 32,558 | 33,867 | 35,458 | 38,057 | 41,376 | 45,021 | 45,454 | 43,078 | 39,451 | 34,559 |
| Age 30-34 | 26,705 | 27,795 | 28,859 | 30,073 | 30,976 | 31,884 | 33,172 | 34,479 | 36,048 | 38,634 | 41,951 |
| Age 35-39 | 25,395 | 24,843 | 24,906 | 25,331 | 26,214 | 27,303 | 28,401 | 29,454 | 30,652 | 31,554 | 32,469 |
| Age 40-44 | 24,450 | 24,977 | 25,479 | 25,818 | 25,937 | 25,943 | 25,401 | 25,463 | 25,877 | 26,756 | 27,843 |
| Age 45-49 | 26,116 | 26,037 | 25,680 | 25,425 | 24,988 | 24,926 | 25,457 | 25,949 | 26,269 | 26,394 | 26,408 |
| Age 50-54 | 25,452 | 25,961 | 26,150 | 26,274 | 26,563 | 26,490 | 26,413 | 26,063 | 25,800 | 25,373 | 25,322 |
| Age 55-59 | 22,558 | 23,213 | 24,003 | 24,571 | 25,176 | 25,705 | 26,209 | 26,393 | 26,503 | 26,790 | 26,725 |
| Age 60-64 | 18,587 | 19,985 | 20,475 | 21,273 | 21,888 | 22,643 | 23,280 | 24,048 | 24,592 | 25,186 | 25,697 |
| Age 65-69 | 12,547 | 13,255 | 14,774 | 16,006 | 17,208 | 18,460 | 19,787 | 20,260 | 21,010 | 21,598 | 22,325 |
| Age 70-74 | 8,550 | 8,901 | 9,547 | 10,367 | 11,232 | 12,058 | 12,710 | 14,124 | 15,261 | 16,374 | 17,535 |
| Age 75-79 | 6,772 | 6,958 | 7,040 | 7,186 | 7,362 | 7,612 | 7,926 | 8,502 | 9,236 | 10,006 | 10,737 |
| Age 80-84 | 5,010 | 5,176 | 5,312 | 5,391 | 5,530 | 5,664 | 5,814 | 5,879 | 6,004 | 6,149 | 6,358 |
| Age 85-89 | 3,188 | 3,305 | 3,381 | 3,489 | 3,585 | 3,656 | 3,770 | 3,861 | 3,925 | 4,025 | 4,124 |
| Age 90-94 | 1,151 | 1,276 | 1,442 | 1,616 | 1,718 | 1,840 | 1,894 | 1,931 | 1,999 | 2,046 | 2,089 |
| Age 95-99 | 271 | 328 | 370 | 396 | 432 | 483 | 541 | 609 | 685 | 720 | 766 |
| Age 100+ | 52 | 52 | 56 | 62 | 66 | 71 | 75 | 77 | 80 | 84 | 87 |
| Age 5-17 | 63,090 | 63,057 | 63,383 | 63,720 | 64,383 | 64,817 | 65,139 | 65,444 | 65,577 | 65,834 | 66,131 |
| Age 18-34 | 116,852 | 117,720 | 118,166 | 118,191 | 117,649 | 116,811 | 116,169 | 115,355 | 114,354 | 113,234 | 111,751 |
| Age 15-44 | 182,003 | 182,226 | 182,915 | 183,657 | 184,305 | 184,926 | 184,987 | 185,385 | 185,861 | 186,708 | 187,417 |
| Age 16 & over | 307,380 | 312,007 | 316,413 | 320,877 | 325,194 | 329,442 | 333,882 | 338,119 | 342,272 | 346,290 | 350,433 |
| Age 18 & over | 296,951 | 301,987 | 306,781 | 311,396 | 315,548 | 319,665 | 323,847 | 327,968 | 332,247 | 336,289 | 340,236 |
| Age 65 & over | 37,541 | 39,251 | 41,922 | 44,513 | 47,133 | 49,844 | 52,517 | 55,243 | 58,200 | 61,002 | 64,021 |
| Age 85 & over | 4,662 | 4,961 | 5,249 | 5,563 | 5,801 | 6,050 | 6,280 | 6,478 | 6,689 | 6,875 | 7,066 |
| | | | | | | | | | | | |
| | | | | | | | | | | | |
| Single Year of Age: | 2010 | 2011 | 2012 | 2013 | 2014 | 2015 | 2016 | 2017 | 2018 | 2019 | 2020 |
| Total | 384,504 | 389,386 | 394,356 | 399,271 | 403,973 | 408,648 | 413,282 | 417,836 | 422,379 | 426,810 | 431,193 |
| Age 0 | 4,726 | 4,741 | 4,766 | 4,799 | 4,826 | 4,855 | 4,874 | 4,893 | 4,925 | 4,963 | 4,996 |
| Age 1 | 4,944 | 4,728 | 4,743 | 4,769 | 4,801 | 4,826 | 4,856 | 4,874 | 4,897 | 4,925 | 4,962 |
| Age 2 | 4,863 | 4,970 | 4,756 | 4,769 | 4,798 | 4,829 | 4,854 | 4,888 | 4,904 | 4,924 | 4,953 |
| Age 3 | 4,984 | 4,891 | 5,004 | 4,786 | 4,802 | 4,827 | 4,855 | 4,883 | 4,915 | 4,933 | 4,954 |
| Age 4 | 4,946 | 5,012 | 4,923 | 5,032 | 4,815 | 4,829 | 4,857 | 4,886 | 4,914 | 4,942 | 4,961 |
| Age 5 | 4,863 | 4,974 | 5,044 | 4,951 | 5,059 | 4,844 | 4,856 | 4,884 | 4,916 | 4,942 | 4,974 |
| Age 6 | 4,897 | 4,891 | 5,008 | 5,072 | 4,979 | 5,089 | 4,874 | 4,891 | 4,916 | 4,945 | 4,970 |
| Age 7 | 4,717 | 4,925 | 4,925 | 5,034 | 5,100 | 5,011 | 5,120 | 4,903 | 4,919 | 4,943 | 4,975 |
| Age 8 | 4,758 | 4,745 | 4,959 | 4,951 | 5,062 | 5,132 | 5,039 | 5,148 | 4,933 | 4,947 | 4,973 |
| Age 9 | 4,803 | 4,786 | 4,779 | 4,985 | 4,979 | 5,094 | 5,162 | 5,067 | 5,178 | 4,963 | 4,979 |
| Age 10 | 4,944 | 4,831 | 4,820 | 4,805 | 5,013 | 5,011 | 5,124 | 5,188 | 5,097 | 5,207 | 4,990 |
| Age 11 | 4,743 | 4,972 | 4,865 | 4,848 | 4,833 | 5,045 | 5,041 | 5,152 | 5,220 | 5,128 | 5,236 |
| Age 12 | 4,748 | 4,771 | 5,006 | 4,893 | 4,874 | 4,865 | 5,075 | 5,071 | 5,184 | 5,250 | 5,158 |
| Age 13 | 4,672 | 4,776 | 4,805 | 5,033 | 4,919 | 4,906 | 4,896 | 5,104 | 5,103 | 5,214 | 5,280 |
| Age 14 | 4,639 | 4,700 | 4,808 | 4,831 | 5,060 | 4,951 | 4,936 | 4,923 | 5,133 | 5,131 | 5,242 |
| Age 15 | 4,877 | 4,666 | 4,732 | 4,836 | 4,859 | 5,092 | 4,981 | 4,962 | 4,953 | 5,163 | 5,157 |
| Age 16 | 5,091 | 4,903 | 4,699 | 4,758 | 4,862 | 4,889 | 5,120 | 5,007 | 4,992 | 4,981 | 5,189 |
| Age 17 | 5,338 | 5,117 | 4,933 | 4,723 | 4,784 | 4,888 | 4,915 | 5,144 | 5,033 | 5,020 | 5,008 |
| Age 18 | 7,507 | 5,362 | 5,147 | 4,959 | 4,749 | 4,812 | 4,918 | 4,941 | 5,172 | 5,061 | 5,046 |
| Age 19 | 10,545 | 7,531 | 5,394 | 5,172 | 4,983 | 4,775 | 4,838 | 4,942 | 4,967 | 5,198 | 5,087 |
| Age 20 | 9,940 | 10,564 | 7,553 | 5,416 | 5,195 | 5,011 | 4,803 | 4,863 | 4,969 | 4,994 | 5,224 |
| Age 21 | 8,860 | 9,959 | 10,584 | 7,578 | 5,440 | 5,222 | 5,038 | 4,828 | 4,889 | 4,994 | 5,020 |
| Age 22 | 7,843 | 8,880 | 9,978 | 10,607 | 7,601 | 5,464 | 5,246 | 5,061 | 4,851 | 4,915 | 5,020 |
| Age 23 | 7,187 | 7,863 | 8,899 | 10,002 | 10,626 | 7,622 | 5,489 | 5,271 | 5,084 | 4,877 | 4,940 |
| Age 24 | 6,992 | 7,208 | 7,885 | 8,926 | 10,022 | 10,645 | 7,644 | 5,516 | 5,296 | 5,110 | 4,904 |
| Age 25 | 6,709 | 7,015 | 7,232 | 7,912 | 8,946 | 10,040 | 10,664 | 7,668 | 5,538 | 5,320 | 5,138 |
| Age 26 | 6,365 | 6,733 | 7,037 | 7,258 | 7,934 | 8,966 | 10,060 | 10,684 | 7,692 | 5,564 | 5,345 |
| Age 27 | 6,375 | 6,389 | 6,757 | 7,064 | 7,281 | 7,955 | 8,989 | 10,085 | 10,706 | 7,715 | 5,589 |
| Age 28 | 5,998 | 6,399 | 6,415 | 6,783 | 7,089 | 7,304 | 7,979 | 9,013 | 10,106 | 10,726 | 7,738 |
| Age 29 | 5,826 | 6,022 | 6,426 | 6,441 | 6,807 | 7,111 | 7,329 | 8,004 | 9,036 | 10,126 | 10,749 |
| Age 30 | 5,918 | 5,850 | 6,049 | 6,451 | 6,464 | 6,830 | 7,136 | 7,355 | 8,027 | 9,056 | 10,148 |
| Age 31 | 5,574 | 5,942 | 5,877 | 6,075 | 6,474 | 6,488 | 6,855 | 7,161 | 7,376 | 8,049 | 9,079 |
| Age 32 | 5,291 | 5,598 | 5,967 | 5,903 | 6,097 | 6,497 | 6,513 | 6,880 | 7,184 | 7,398 | 8,072 |
| Age 33 | 5,066 | 5,315 | 5,625 | 5,994 | 5,925 | 6,121 | 6,523 | 6,538 | 6,902 | 7,206 | 7,422 |
| Age 34 | 4,856 | 5,090 | 5,341 | 5,650 | 6,016 | 5,948 | 6,145 | 6,545 | 6,559 | 6,925 | 7,230 |
| Age 35 | 4,939 | 4,880 | 5,116 | 5,367 | 5,673 | 6,038 | 5,974 | 6,170 | 6,569 | 6,582 | 6,949 |
| Age 36 | 4,807 | 4,962 | 4,906 | 5,141 | 5,390 | 5,694 | 6,064 | 5,997 | 6,192 | 6,591 | 6,607 |
| Age 37 | 4,997 | 4,830 | 4,988 | 4,931 | 5,165 | 5,411 | 5,719 | 6,087 | 6,020 | 6,214 | 6,614 |
| Age 38 | 5,131 | 5,019 | 4,854 | 5,013 | 4,952 | 5,186 | 5,434 | 5,742 | 6,108 | 6,040 | 6,237 |
| Age 39 | 5,521 | 5,152 | 5,042 | 4,879 | 5,034 | 4,974 | 5,210 | 5,458 | 5,763 | 6,127 | 6,062 |
| Age 40 | 5,043 | 5,541 | 5,176 | 5,067 | 4,901 | 5,055 | 4,999 | 5,233 | 5,479 | 5,783 | 6,148 |
| Age 41 | 4,793 | 5,063 | 5,561 | 5,199 | 5,088 | 4,921 | 5,076 | 5,020 | 5,252 | 5,501 | 5,803 |
| Age 42 | 4,783 | 4,813 | 5,085 | 5,586 | 5,219 | 5,107 | 4,943 | 5,098 | 5,041 | 5,272 | 5,519 |
| Age 43 | 4,738 | 4,803 | 4,834 | 5,109 | 5,603 | 5,238 | 5,127 | 4,964 | 5,120 | 5,061 | 5,292 |
| Age 44 | 5,093 | 4,757 | 4,823 | 4,857 | 5,126 | 5,622 | 5,256 | 5,148 | 4,985 | 5,139 | 5,081 |
| Age 45 | 5,203 | 5,111 | 4,776 | 4,846 | 4,875 | 5,144 | 5,639 | 5,275 | 5,166 | 5,003 | 5,156 |
| Age 46 | 5,325 | 5,219 | 5,128 | 4,798 | 4,862 | 4,892 | 5,163 | 5,655 | 5,292 | 5,185 | 5,023 |
| Age 47 | 5,151 | 5,340 | 5,236 | 5,149 | 4,816 | 4,880 | 4,911 | 5,179 | 5,671 | 5,310 | 5,202 |
| Age 48 | 5,186 | 5,166 | 5,357 | 5,257 | 5,164 | 4,831 | 4,897 | 4,927 | 5,195 | 5,685 | 5,326 |
| Age 49 | 5,251 | 5,201 | 5,183 | 5,375 | 5,271 | 5,179 | 4,847 | 4,913 | 4,945 | 5,211 | 5,701 |
| Age 50 | 5,354 | 5,265 | 5,216 | 5,200 | 5,388 | 5,284 | 5,195 | 4,865 | 4,929 | 4,961 | 5,227 |
| Age 51 | 5,107 | 5,367 | 5,279 | 5,234 | 5,214 | 5,402 | 5,298 | 5,207 | 4,882 | 4,946 | 4,977 |
| Age 52 | 5,119 | 5,119 | 5,379 | 5,297 | 5,246 | 5,227 | 5,413 | 5,312 | 5,224 | 4,896 | 4,960 |
| Age 53 | 5,069 | 5,130 | 5,132 | 5,395 | 5,308 | 5,259 | 5,239 | 5,427 | 5,325 | 5,235 | 4,910 |
| Age 54 | 4,803 | 5,080 | 5,144 | 5,148 | 5,407 | 5,318 | 5,268 | 5,252 | 5,440 | 5,335 | 5,248 |
| Age 55 | 4,881 | 4,814 | 5,091 | 5,155 | 5,158 | 5,414 | 5,328 | 5,279 | 5,262 | 5,448 | 5,347 |
| Age 56 | 4,548 | 4,890 | 4,823 | 5,103 | 5,163 | 5,166 | 5,422 | 5,336 | 5,290 | 5,268 | 5,455 |
| Age 57 | 4,617 | 4,557 | 4,897 | 4,834 | 5,108 | 5,169 | 5,171 | 5,426 | 5,340 | 5,295 | 5,277 |
| Age 58 | 4,323 | 4,624 | 4,563 | 4,906 | 4,838 | 5,113 | 5,174 | 5,176 | 5,432 | 5,346 | 5,298 |
| Age 59 | 4,189 | 4,328 | 4,629 | 4,573 | 4,909 | 4,843 | 5,114 | 5,176 | 5,179 | 5,433 | 5,348 |
| Age 60 | 4,140 | 4,193 | 4,332 | 4,634 | 4,576 | 4,910 | 4,844 | 5,114 | 5,177 | 5,180 | 5,429 |
| Age 61 | 3,953 | 4,143 | 4,196 | 4,340 | 4,634 | 4,575 | 4,908 | 4,844 | 5,113 | 5,174 | 5,176 |
| Age 62 | 3,852 | 3,956 | 4,144 | 4,200 | 4,339 | 4,631 | 4,573 | 4,905 | 4,842 | 5,109 | 5,168 |
| Age 63 | 3,844 | 3,853 | 3,955 | 4,146 | 4,199 | 4,334 | 4,628 | 4,568 | 4,899 | 4,835 | 5,099 |
| Age 64 | 2,798 | 3,840 | 3,848 | 3,953 | 4,140 | 4,193 | 4,327 | 4,617 | 4,561 | 4,888 | 4,825 |
| Age 65 | 2,837 | 2,800 | 3,833 | 3,845 | 3,947 | 4,130 | 4,183 | 4,316 | 4,604 | 4,548 | 4,872 |
| Age 66 | 2,718 | 2,837 | 2,801 | 3,825 | 3,836 | 3,935 | 4,117 | 4,169 | 4,303 | 4,586 | 4,531 |
| Age 67 | 2,606 | 2,716 | 2,834 | 2,801 | 3,810 | 3,820 | 3,918 | 4,098 | 4,151 | 4,284 | 4,563 |
| Age 68 | 2,302 | 2,602 | 2,712 | 2,830 | 2,795 | 3,791 | 3,800 | 3,899 | 4,078 | 4,129 | 4,259 |
| Age 69 | 2,084 | 2,300 | 2,594 | 2,705 | 2,820 | 2,784 | 3,769 | 3,778 | 3,874 | 4,051 | 4,100 |
| Age 70 | 1,946 | 2,082 | 2,295 | 2,589 | 2,694 | 2,807 | 2,772 | 3,741 | 3,750 | 3,845 | 4,018 |
| Age 71 | 1,771 | 1,915 | 2,048 | 2,257 | 2,546 | 2,650 | 2,761 | 2,726 | 3,680 | 3,688 | 3,782 |
| Age 72 | 1,686 | 1,740 | 1,881 | 2,010 | 2,217 | 2,498 | 2,602 | 2,710 | 2,679 | 3,615 | 3,622 |
| Age 73 | 1,542 | 1,653 | 1,705 | 1,842 | 1,971 | 2,173 | 2,447 | 2,550 | 2,657 | 2,625 | 3,543 |
| Age 74 | 1,605 | 1,511 | 1,618 | 1,669 | 1,804 | 1,930 | 2,128 | 2,397 | 2,495 | 2,601 | 2,570 |
| Age 75 | 1,506 | 1,570 | 1,476 | 1,582 | 1,632 | 1,762 | 1,887 | 2,079 | 2,342 | 2,440 | 2,541 |
| Age 76 | 1,409 | 1,470 | 1,530 | 1,439 | 1,543 | 1,591 | 1,720 | 1,838 | 2,027 | 2,286 | 2,380 |
| Age 77 | 1,353 | 1,372 | 1,430 | 1,489 | 1,400 | 1,501 | 1,546 | 1,673 | 1,790 | 1,971 | 2,222 |
| Age 78 | 1,272 | 1,313 | 1,332 | 1,387 | 1,445 | 1,360 | 1,456 | 1,502 | 1,624 | 1,737 | 1,913 |
| Age 79 | 1,232 | 1,233 | 1,272 | 1,289 | 1,342 | 1,398 | 1,317 | 1,410 | 1,453 | 1,572 | 1,681 |
| Age 80 | 1,153 | 1,189 | 1,189 | 1,228 | 1,244 | 1,297 | 1,351 | 1,269 | 1,360 | 1,403 | 1,515 |
| Age 81 | 1,045 | 1,111 | 1,147 | 1,144 | 1,181 | 1,197 | 1,247 | 1,297 | 1,223 | 1,309 | 1,351 |
| Age 82 | 1,056 | 1,003 | 1,064 | 1,098 | 1,096 | 1,133 | 1,147 | 1,197 | 1,244 | 1,172 | 1,253 |
| Age 83 | 913 | 1,008 | 956 | 1,016 | 1,047 | 1,047 | 1,078 | 1,094 | 1,140 | 1,186 | 1,117 |
| Age 84 | 843 | 865 | 956 | 905 | 962 | 990 | 991 | 1,022 | 1,037 | 1,079 | 1,122 |
| Age 85 | 830 | 792 | 811 | 895 | 851 | 905 | 931 | 929 | 959 | 973 | 1,013 |
| Age 86 | 673 | 773 | 737 | 755 | 833 | 790 | 838 | 864 | 863 | 892 | 905 |
| Age 87 | 672 | 621 | 713 | 679 | 695 | 768 | 728 | 771 | 797 | 796 | 823 |
| Age 88 | 561 | 613 | 567 | 650 | 619 | 634 | 700 | 665 | 706 | 728 | 727 |
| Age 89 | 452 | 506 | 553 | 510 | 587 | 559 | 573 | 632 | 600 | 636 | 656 |
| Age 90 | 371 | 404 | 452 | 493 | 455 | 525 | 501 | 512 | 565 | 537 | 566 |
| Age 91 | 260 | 327 | 358 | 399 | 436 | 403 | 464 | 442 | 451 | 496 | 470 |
| Age 92 | 204 | 227 | 287 | 311 | 350 | 380 | 351 | 399 | 383 | 393 | 434 |
| Age 93 | 168 | 176 | 196 | 246 | 268 | 302 | 326 | 301 | 345 | 329 | 339 |
| Age 94 | 148 | 142 | 149 | 167 | 209 | 230 | 252 | 277 | 255 | 291 | 280 |
| Age 95 | 104 | 124 | 118 | 125 | 140 | 174 | 189 | 211 | 232 | 214 | 245 |
| Age 96 | 67 | 86 | 103 | 98 | 104 | 113 | 143 | 155 | 175 | 192 | 176 |
| Age 97 | 58 | 55 | 69 | 82 | 80 | 83 | 91 | 116 | 127 | 141 | 153 |
| Age 98 | 20 | 47 | 43 | 56 | 66 | 63 | 68 | 74 | 93 | 99 | 113 |
| Age 99 | 22 | 16 | 37 | 35 | 42 | 50 | 50 | 53 | 58 | 74 | 79 |
| Age 100+ | 52 | 52 | 56 | 62 | 66 | 71 | 75 | 77 | 80 | 84 | 87 |
| | | | | | | | | | | |
| | | | | | | | | | | |
| | | | | | | | | | | | |
| | | | | | | | | | | | |
| | | | | | | | | | | | |
| | | | | | | | | | | | |
| | | | | | | | | | | | |
| | | | | | | | | | | | |
Notes Source: ProximityOne Outlook2060 (888.364.7656) Copyright (c) 2013. ProximityOne. All Rights Reserved
Terms of Use. Estimates and projections accessible via this Web page
are proprietary to ProximityOne.
The data may be used in any manner without further authorization except that the data may not be converted into a data file and distributed.
Links to this page are encouraged as well as use of the data in stories and analyses.
While best efforts have been made to develop the most accurate data possible, any use of these data is solely at the discretion of the user.
There is no warranty or guarantee of any type.
Additional Information
More about ProximityOne demographic-economic estimates and projections:
• Outlook 2018 |
Outlook 2030 |
Outlook 2060 |
Quarterly 3 year
• integrated multi-sourced Situation & Outlook demographic-economic data
ProximityOne develops geographic-demographic-economic data and analytical tools and helps organizations knit together and use diverse data in a decision-making and analytical framework. We develop custom demographic/economic estimates and projections, develop geographic and geocoded address files, and assist with impact and geospatial analyses.
Wide-ranging organizations use our tools (software, data, methodologies) to analyze their own data integrated with other data.
Follow ProximityOne on Twitter at
www.twitter.com/proximityone.
Contact ProximityOne (888-364-7656) with questions about data covered in this section or to discuss custom estimates, projections or analyses for your areas of interest.
|