
|
|
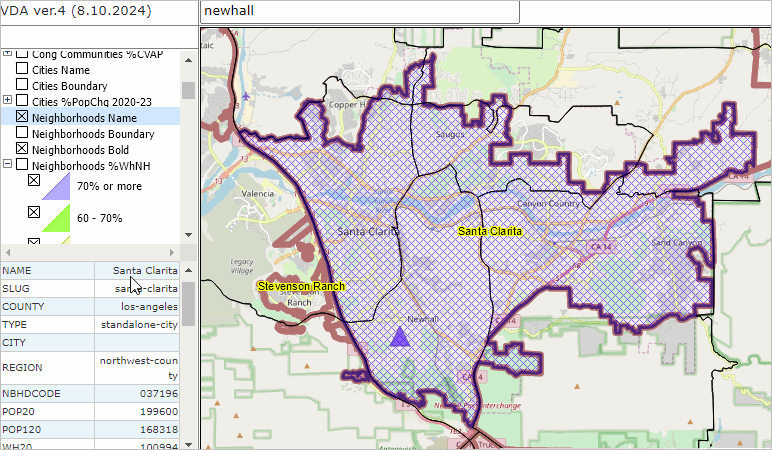
-- find/examine a neighborhood -- examine in context of related geography August 2024 .. Most of us live in a neigborhood, know it by name and have a sense of the location and geography. Neighborhoods give area residents a sense of where you live or how your neighborhood compares to others. Typically the boundaries are a geography that is a part of a city or county. This section is focused on Los Angeles County, CA neighborhoods as defined by the Los Angeles Times developed with input from area residents. The interactive tools available in this section provide insights into neighborhoods in the context of cities, counties, congressional and legislative districts, congressional communities, schools and school districts and other areas. You can locate a neighborhood based on an address or location using these tools: • interactive mapping tool to locate a neighborhood based on an address or location. • interactive table to view, rank, compare, each/all neighborhoods. Mapping Neighborhoods .. using iVDA part of Visual Data Analytics .. more options available using VDAGIS Discovery The start-up view is presented below in an interactive mapping window .. watch video Locate a neighborhood .. see it on a map .. examine its demographics Click a box to view instructions. Find a neighborhood based on an address/location .. zooms to neighborhood.. enter an address or location like "Newhall" (no quotes, not case sensitive).. the map view zooms-in to the neighborhood containing the location and shows the neighborhood crosshatched. .. view the demographic profile for this neighborhood is displayed in the lower left panel. .. here you can examine many demographic subject matter items for that neighbborhood. .. change layer view .. in the Legend Panel at left of map: uncheck layer "Neighborhoods %WhNH" check on layer "Neighborhoods Name" check on layer "Neighborhoods Bold" .. Try a different address or location, maybe the ZIP code "90068" or any address/location. .. The view will zoom to that neighborhood. Show that neighborhood in the context of Congressional Communities.
.. proceeding with above view .. check on layer "Cong Communities Name" check on layer "Cong Communitess Boundary" .. the CC code and boundaries now show in map view .. the relationship of the CCs and neighborhoods can now be examined. .. click on a CC .. it shows as crosshatched. .. view the demographic profile for this CC displayed in the lower left panel. .. here you can examine many demographic subject matter items for that CC. .. optionally click on other layers in the Legend Panel. .. Try a different address or location, maybe "UCLA" or any address/location. .. The view will zoom to that neigborhood and show CCs. Examine Neighborhoods by Patterns of Economic Prosperity by Census Tract.. in the Legend Panel, left of map, click "Tracts $MHI" ckeckbox on (scroll down).. This iVDA uses the beta version. See additional notes below iVDA mapping frame. Illustrative View from Above Steps  Los Angeles County Neighborhoods .. interactive table .. goto top .. 270 neighborhoods .. see usage notes below table. Interactive Table Usage Notes .. Click ShowAll button between queries. .. The above table is an interactive table. Use the buttons below the table to manage interactive operations. Within the table itself, navigate up and down with vertical and horizontal scroll bars. Use mouseover for expanded description of the subject matter header cells Click a header cell to sort one direction, click again to sort the other direction. How to save your neighborhood data .. .. Copy row to clipboard. Click a row in the table and it turns blue. Right-click to copy that row to clipboard. .. With a spreadsheet application open, click ctrl-V to paste those cells into the spreadsheet for further data use. Find in Name button. Key in neighborhood name (or part) then click Find in Name button. .. e.g., Newhall .. the table refreshes with San Clarita neighborhood characteristics/rows Items in Table Neighborhood Name Neighborhood Code Population %White %White Non Hispanic %Black %American Ind %Asian %Native Hawaiian & OPI %Hispanic Population One Race White Alone Black Alone AmInd Alone Asian Alone NHOPI Alone Other Race Multi Race White NonHispanic Black NonHispanic Hispanic Population 18+ Population One Race 18+ White ALone 18+ Black Alone 18+ AmInd Alone 18+ Asian Alone 18+ NHOPI Alone 18+ Other Race 18+ Multi Race 18+ White NonHispanic 18+ Black NonHispanic 18+ Hispanic 18+ Group Quarters Group Quarters Institutional Group Quarters NonInstitutional Housing Units Occupied units Vacant Units Web Session Support Learn more about accessing and using demographic-economic data and related analytical tools. Join us in a Data Analytics Lab session. There is no fee for these one-hour Web sessions. Each informal session is focused on a specific topic. The open structure also provides for Q&A and discussion of application issues of interest to participants. Additional Information ProximityOne develops geodemographic-economic data and analytical tools and helps organizations knit together and use diverse data in a decision-making and analytical framework. We develop custom demographic/economic estimates and projections, develop geographic and geocoded address files, and assist with impact and geospatial analyses. Wide-ranging organizations use our tools (software, data, methodologies) to analyze their own data integrated with other data. Contact us (888-364-7656) with questions about data covered in this section or to discuss custom estimates, projections or analyses for your areas of interest. |
| |