
|
|
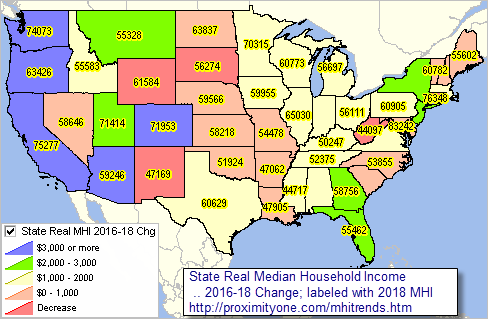
-- based on American Community Survey 1-year estimates -- examining trends in annual real median household income, 2005-2018 During the past two years, 2017 and 2018, the real median household income increased by $1,627. Some states experienced a decline in real median household income in the past two years. During the previous two years, 2015 and 2016, the real median household income increased by $3,329. See details in interactive table below. Real median household income in the U.S. increased 0.8 percent between the 2017 ACS and 2018 ACS based on the American Community Survey (ACS 2018). The U.S. MHI, based on ACS 2018 (released September 2019), was $61,937. The national MHI has been increasing since 2013. The increase from 2017 is smaller than the prior 3 years, during which MHI increased between 1.8 percent and 3.3 percent annually. This was the second consecutive year that U.S. MHI was higher than 2007. Use the interactive table below and related Geographic Information System (GIS) resources to examine income trends and geographic patterns. See details on using GIS project below. ProximityOne uses ACS data to develop current estimates and projections. Access these data through the ProximityOne Data Service tools. See related MHI sections below Patterns of Real Median Household Income Change; 2016-2018 -- change during two calendar years labeled with 2018 real MHI -- click link for larger view; expand browser window for best quality view.  - view developed using ProximityOne CV XE GIS and related GIS project. - geospatial analyze income characteristics integrated with your data to examine patterns; gain insights. U.S. & State Median Household Income: Annually 2005–2018 -- Interactive Table data are in 2018 inflation-adjusted dollars. Click column header to sort; click again to sort other direction. See usage notes below table. See related Related Interactive Tables Usage Notes • Click "Selected Cols" below table to view change and trend columns. Items included in table and GIS project.
- Area Name
- MHI 2005 - MHI 2006 - MHI 2007 - MHI 2008 - MHI 2009 - MHI 2010 - MHI 2011 - MHI 2012 - MHI 2013 - MHI 2014 - MHI 2015 - MHI 2016 - MHI 2017 - MHI 2018 - MHI Chg 2017-18 - MHI %Chg 2017-18 - MHI Chg 2016-18 - MHI %Chg 2016-18 - MHI Chg 2010-18 - MHI %Chg 2010-18 Steps to Develop Custom MHI Pattern Analysis Maps (requires Windows computer with Internet connection) 1. Install the ProximityOne CV XE GIS ... run the CV XE GIS installer ... take all defaults during installation 2. Download the MHI GIS project fileset ... requires UserID ... unzip MHI GIS project files to local folder c:\mhitrends 3. Open the c:\mhitrends\mhitrends.gis project ... after completing the above steps, click File>Open>Dialog ... open the file named c:\mhitrends\mhitrends.gis 4. Done. The start-up view is shown at top of this section. Related MHI Sections .. goto top • Corresponding Blog Post • County Household Income & Income Inequality Patterns • Median Household Income by State & County .. U.S. by county annual model based estimates (updates in October & December) Terms & Concepts .. goto top Household income. Household income includes income of the householder and all other people 15 years and older in the household, whether or not they are related to the householder. Median. The median is that value that divides the household income distribution into halves, one-half with income above the median and the other with income below the median. The median is based on the income distribution of all households, Real Income. Income data presented here inflation-adjusted to 2018 dollars. Real income refers to income after adjusting for inflation. Inflation adjustments are computed using the CPI-U-RS. ProximityOne User Group ... goto top Join the ProximityOne User Group to keep up-to-date with new developments relating to metros and component geography decision-making information resources. Receive updates and access to tools and resources available only to members. Use this form to join the User Group. Support Using these Resources Learn more about accessing and using demographic-economic data and related analytical tools. Join us in a Data Analytics Lab session. There is no fee for these one-hour Web sessions. Each informal session is focused on a specific topic. The open structure also provides for Q&A and discussion of application issues of interest to participants. Additional Information ProximityOne develops geodemographic-economic data and analytical tools and helps organizations knit together and use diverse data in a decision-making and analytical framework. We develop custom demographic/economic estimates and projections, develop geographic and geocoded address files, and assist with impact and geospatial analyses. Wide-ranging organizations use our tools (software, data, methodologies) to analyze their own data integrated with other data. Follow ProximityOne on Twitter at www.twitter.com/proximityone. Contact us (888-364-7656) with questions about data covered in this section or to discuss custom estimates, projections or analyses for your areas of interest. |
|
|